Figure 4.
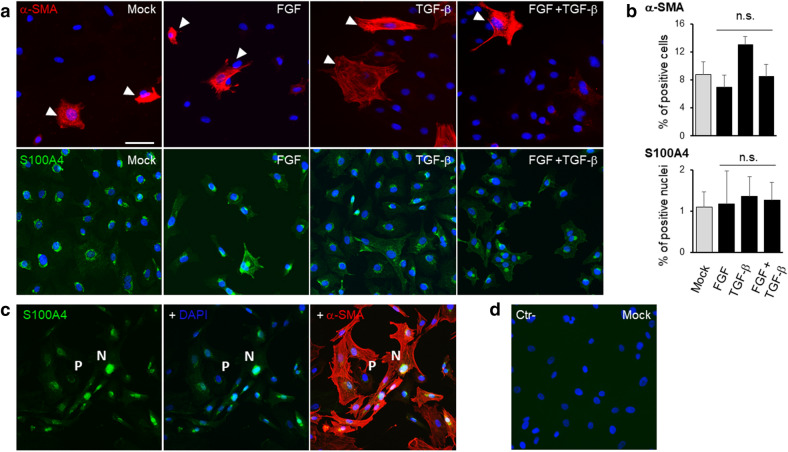
EnMT investigation upon bFGF and TGF-β on rCEnC. (a) The panel shows representative immunofluorescence images of α-SMA (red, first row) and S100A4 (green, second row) in rCEnC treated with Mock control, bFGF, TGF-β and bFGF + TGF-β, respectively. White arrows indicate the cells positive for α-SMA. In blue DAPI, scale bar 50 µM for all the images. (b) The bar chart on the right shows the percentage of cells positive for α-SMA and the percentage of cells in which S100A4 moved to the nuclei as a mean of 12 fields (n = 3 biological replicates) for each condition. Results are presented as mean ± SE. T-test was performed n.s. non-significant. (c) The panel illustrates a representative image of a double immunostaining with S100A4 in green, DAPI in blue and α-SMA in red of rCEnC at a high passage number (P10). Letters P, perinuclear, and N, nuclear, underlie the different localization of S100A4 staining, corresponding to a low and high α-SMA positivity, respectively. (d) The panel shows a secondary only control on Mock rCEnC, used as a negative control with DAPI in blue.

