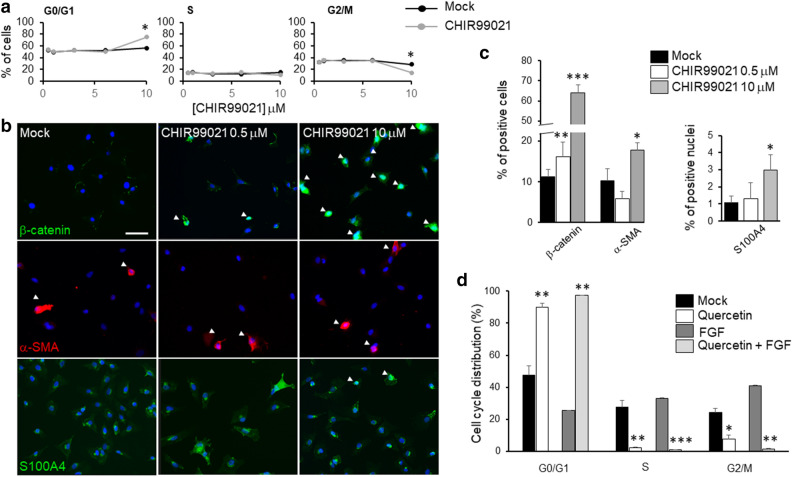
Figure 5.
Effects of β-catenin activator/inhibitor. (a) Percentage of cells in the three phases of the cell cycle identified by Propidium Iodide flow cytofluorimetric analysis, mock is represented with black lines and dots, treated (CHIR99021 at different concentrations) with grey lines and dots. Experiments were performed n = 3 at 0.5, 1 and 10 µM, twice at 3 and 6 µM. Results are presented as mean ± SE. T-test was performed *p < 0.05, **p < 0.01. (b) Representative immunofluorescence images of rCEnC treated with CHIR99021 at 0.5 and 10 µM, in comparison with mock control in the left panel. The top row shows expression of β-catenin (green), the second row is α-SMA (red), the third is S100A4 (green) while blue is DAPI. White arrows indicate cells in which β-catenin translocated to the nuclei and cells that express α-SMA. Scale bar 50 µM. The panel (c) on the right shows a bar chart for the quantification of the immunofluorescence analysis (in % of cells) of cells having β-catenin in the nuclei, expressing α-SMA or presenting S100A4 in the nuclei (12 fields and n = 3 replicates). Results are presented as mean ± Standard Error (SE). T-test was performed *p < 0.05, **p < 0.01, ***p < 0.001. (d) Represents a bar chart of Propidium Iodide flow cytofluorimetric analysis for quercetin treatment of rCEnC. Experiments were performed n = 3. Results are presented as mean ± SE. T-test was performed *p < 0.05, **p < 0.01, ***p < 0.001.

