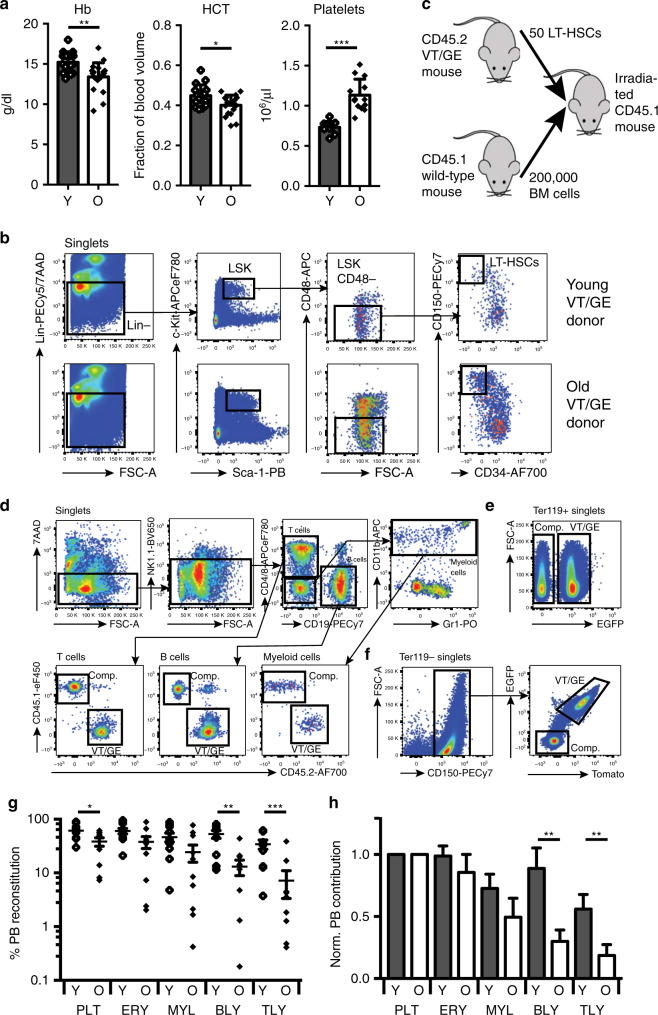
Fig. 1. Effect of ageing on erythropoiesis.
a PB haemoglobin (Hb), haematocrit (HCT) and platelets number measured in young (red cell parameters: N = 16; platelets: N = 11) and old mice (red cell parameters N = 20; platelets: N = 13). Data are from seven independent experiments. Values show mean ± s.e.m. *P < 0.05; **P < 0.01; ***P < 0.001 (two-tailed, unpaired Student’s t test). Exact P values: Hb: 0.0014; HCT: 0.026; Platelets: 0.000003. b Gating strategy for sorting of LT-HSCs from BM of young and old VT/GE CD45.2 transgenic mice used as donors for competitive transplantation. c Experimental design to compare in vivo lineage output of transplanted young and old LT-HSCs. Strategy for measuring donor PB leucocyte (d), erythrocyte (e) and platelet reconstitution (f) in transplanted recipient mice. g PB lineage contribution of young and old HSCs in transplanted recipients (N = 10/condition). The mean values ± s.e.m are indicated, as are P values (two-sided Mann–Whitney U-test) comparing young and old contributions for each lineage. *P < 0.05; **P < 0.01; ***P < 0.001. Exact P values: PLT: 0.03; ERY: 0.12; MYL: 0.06; BLY: 0.003; TLY: 0.003. h Donor HSC PB contribution from g normalised to platelet output. The mean values ± s.e.m are indicated, as are P values (two-sided Mann–Whitney U-test) comparing young and old contributions for each lineage. **P < 0.01. Exact P values: PLT: not applicable; ERY: 0.35; MYL: 0.17; BLY: 0.007; TLY: 0.009). Source data are provided as a source data file.

