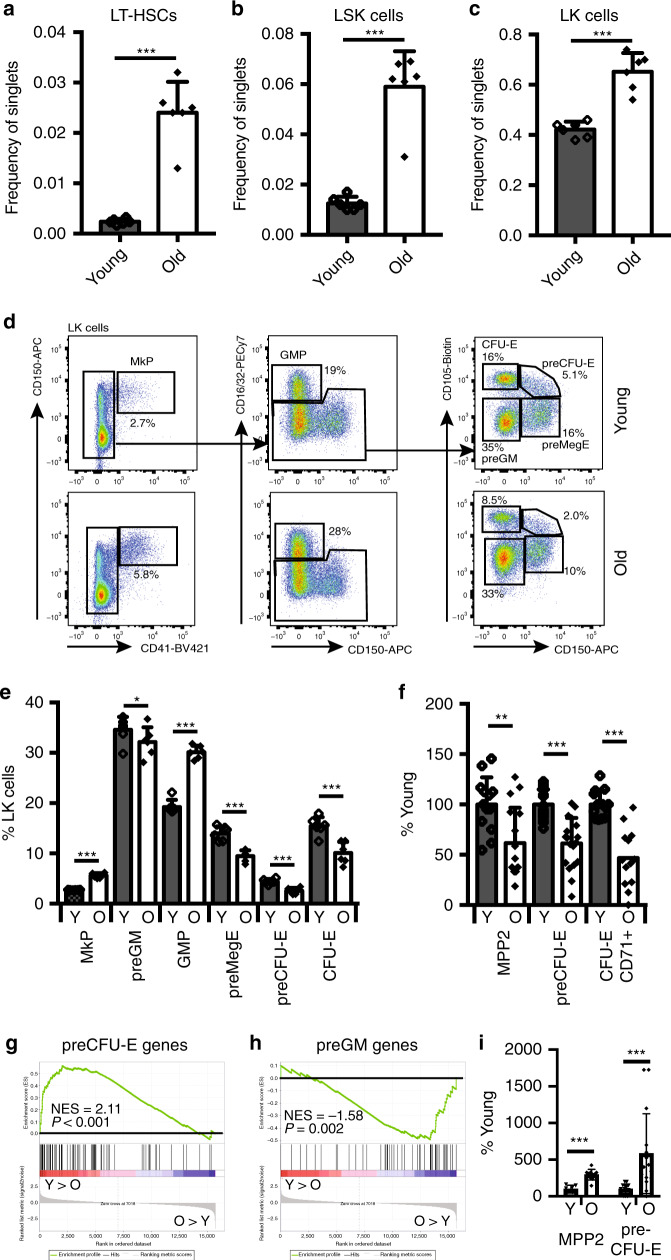
Fig. 2. Effect of ageing on HSCs and myeloid progenitors.
Bar graph showing the number of LT-HSCs (a), LSK (b) and LK (c) cells in bone marrow of young and old mice as frequency of live single cells (N = 6/condition, six independent experiments). Values are mean ± s.d. ***P < 0.001 (two-tailed unpaired Student’s t test). Exact P values: LT-HSCs: 0.000007; LSK: 0.000013; LK: 0.000039. d Representative flow cytometry plots of myelo-erythroid progenitors from young (top panels) and old mice (bottom panels). e Quantification of myelo-erythroid progenitors from young and old mice (N = 6/condition, six independent experiments). Values are mean ± s.d. *P < 0.05; **P < 0.01; ***P < 0.001 (two-tailed unpaired Student’s t test). Exact P values: MkP: 0.00000006; preGM: 0.0407; GMP: 0.00000008; preMegE: 0.0001; preCFU-E: 0.0002; CFU-E: 0.0010. f In vitro erythroid colony-forming potential of MPP2 (young N = 13, old N = 16), preCFU-E (young N = 17, old N = 18) and CD71+ CFU-E (young N = 13, old N = 13) cells from BM of young or old mice (six independent experiments) normalised to colony output from young mice (=100%). Values are mean ± s.e.m. **P < 0.01; ***P < 0.001 (two-tailed unpaired Student’s t test). Exact P values: MPP2: 0.0032; preCFU-E: 0.000005; CFU-E CD71+: 0.000003. g GSEA analysis comparing expression of preCFU-E-specific genes in young and old preCFU-Es. The normalised enrichment score (NES) and P value are shown. h GSEA analysis comparing expression of preGM-specific genes in young and old preCFU-Es. The normalised enrichment score (NES) and P value are shown. i In vitro myeloid colony-forming potential of MPP2 cells (young: N = 7, old: N = 10; two independent experiments) and preCFU-E cells (N = 6/condition, six independent experiments) from BM of young and old mice normalised to colony output from young mice (=100%). Values are mean ± s.e.m. ***P < 0.001 (two-tailed unpaired Student’s t test). Exact P values: MPP2: 0.000022; preCFU-E: 0.0009. Source data are provided as a source data file.

