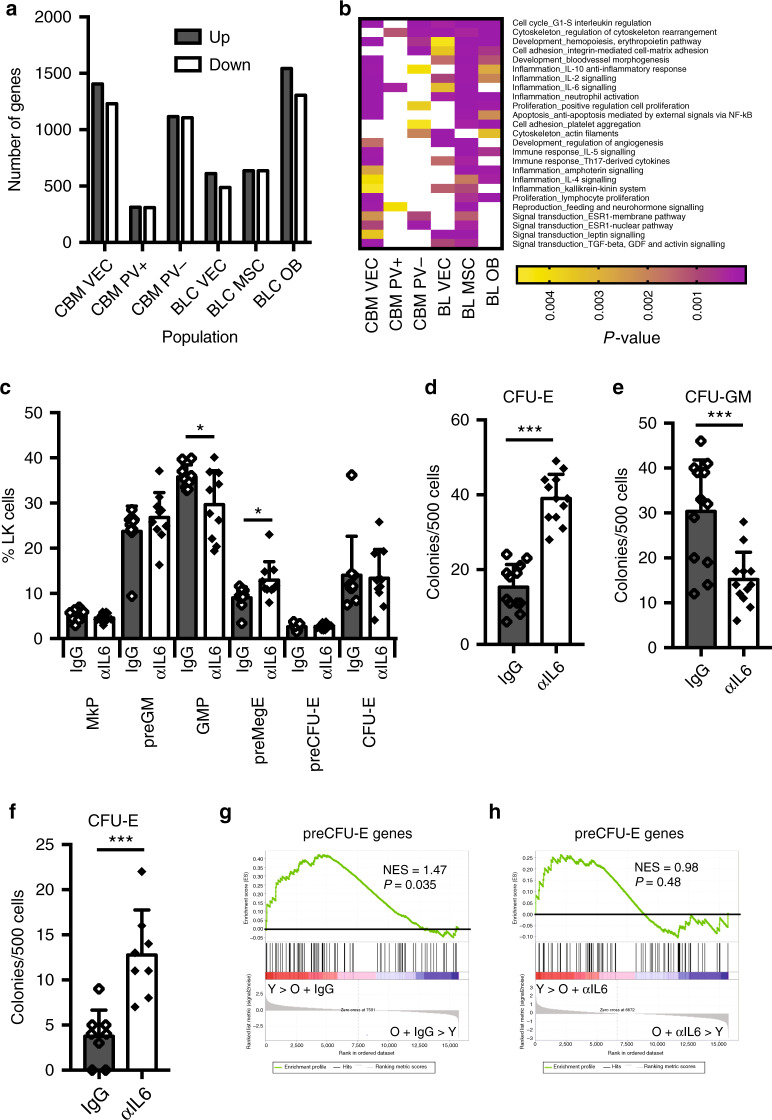
Fig. 3. IL-6 neutralisation improves aged hematopoiesis.
a Bar graph showing the number of genes differentially expressed (>twofold change, adjusted P value <0.05) between young and old stromal cells of the indicated populations. b Heatmap of Metacore Process Networks enriched in three or more aged stromal cell populations at P < 0.005. c Quantification of myelo-erythroid progenitors from old mice treated with control IgG (IgG; N = 9) and neutralising anti-IL-6 antibody (αIL-6; N = 10). Data are from five independent experiments. Values are mean ± s.d. *P < 0.05; **P < 0.01; ***P < 0.001 (two-tailed unpaired Student’s t test). Exact P values: MkP: 0.24; preGM: 0.24; GMP: 0.03; preMegE: 0.02; preCFU-E: 0.82; CFU-E: 0.85. d In vitro colony-forming potential of LK (defined as Lin−Sca-1−c-Kit+ cells) isolated from BM of old mice after injection of IgG isotype control (N = 4) or αIL-6 Ab (N = 4) assayed under E condition (M3436; 500 cells). Data are from two different experiments. Values show mean ± s.e.m. ***P < 0.001 (two-tailed unpaired Student’s t test). Exact P value: 0.000000005. e In vitro colony-forming potential of LK (defined as Lin−Sca-1−c-Kit+ cells) isolated from BM of old mice after injection of IgG isotype control (N = 4) or αIL-6 Ab (N = 4) assayed under GM condition (M3534; 500 cells). Data are from two different experiments. Values show mean ± s.e.m. ***P < 0.001 (two-tailed unpaired Student’s t test). Exact P value: 0.0005. f In vitro colony-forming potential of preCFU-E cells isolated from BM of old mice after injection of IgG isotype control (N = 4) or αIL-6 Ab (N = 4) assayed under E condition (M3436; 500 cells). Data are from two different experiments. Values show mean ± s.e.m. ***P < 0.001 (two-tailed unpaired Student’s t test). Exact P value = 0.0005. g GSEA analysis comparing expression of preCFU-E-specific genes in preCFU-Es isolated from young and old IgG-treated mice. The normalised enrichment score (NES) and P value are shown. h GSEA analysis comparing expression of preCFU-E-specific genes in preCFU-Es isolated from young and old anti-IL-6-treated CFU-Es. The normalised enrichment score (NES) and P value are shown. Source data are provided as a source data file.

