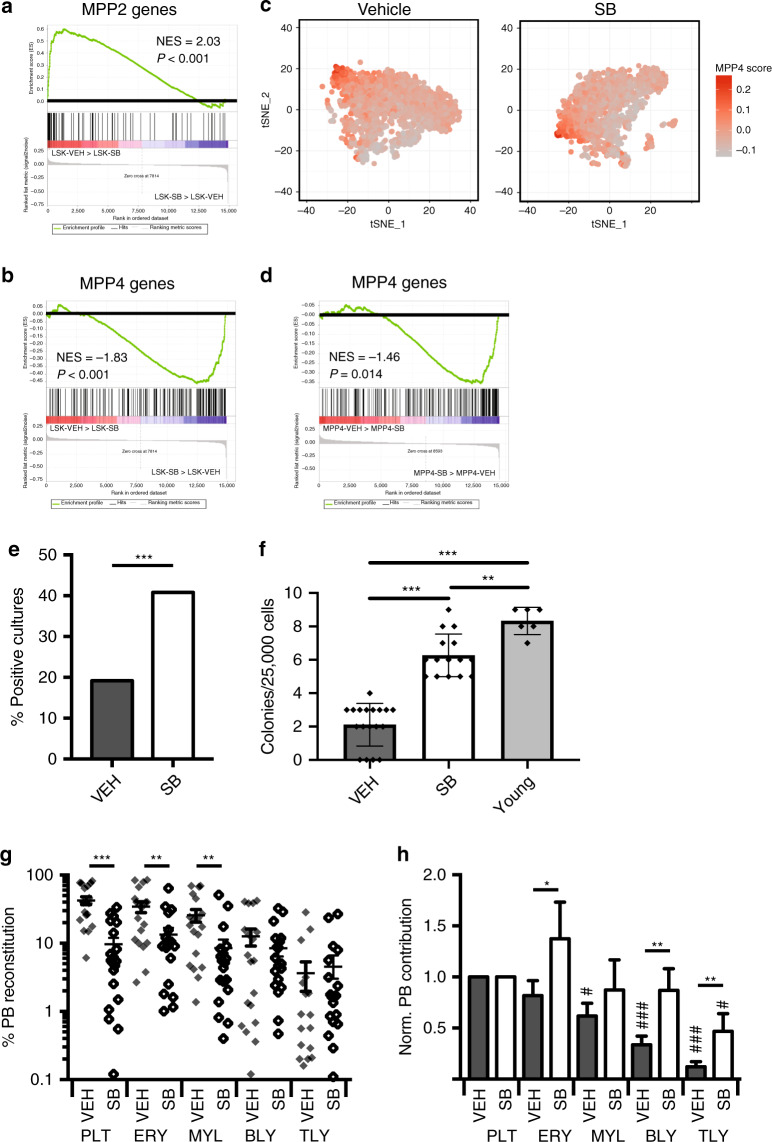
Fig. 5. TGFβR1 inhibition rebalances aged HSC lineage output.
a GSEA analysis of MPP2-specific genes in LSK cells from vehicle (VEH) and SB-treated old mice. Normalised enrichment score (NES) and P value are shown (P < 0.001). b GSEA analysis of MPP4-specific genes in LSK cells isolated from vehicle (VEH) and SB-treated old mice. Normalised enrichment score (NES) and P value are shown (P < 0.001). c tSNE plot of vehicle and SB-treated single LSK cell transcriptomes. d GSEA analysis of MPP4-specific genes in computationally defined MPP4 cells isolated from vehicle and SB-treated old mice. The normalised enrichment score (NES) and P value are shown (P = 0.014). e Fraction of LSK cultures from vehicle and SB-treated old mice (10 cells plated/culture) positive for B-lymphocytes after 3 weeks of culture. N = 192 cultures/condition, two independent experiments. ***P < 0.001 (two-sided χ2 test). Exact P value: 0.0004. f In vitro colony-forming potential of B precursor cells isolated young mice (N = 6), vehicle (N = 18) and SB-treated (N = 15) old mice after plating 25.000 cells in M3630 medium. Data from two different experiments. Values show mean ± s.e.m. **P < 0.01; ***P < 0.001 (two-tailed unpaired Student’s t test). Exact P values: VEH-SB: 0.0000000002; SB-Young: 0.0017; VEH-Young: 0.0000000002. g PB lineage contribution of LT-HSCs from vehicle (VEH) and SB-treated (SB) old mice in transplanted recipients (VEH: N = 19; SB: N = 20; three independent experiments). Mean values ± s.e.m are shown. **P < 0.01; ***P < 0.001 (two-sided Mann–Whitney U-test). Exact P values: PLT: 0.000002; ERY: 0.002; MYL: 0.002; BLY: 0.66; TLY: 0.41. h Donor HSC PB contribution of LT-HSCs isolated from vehicle (VEH) and SB-treated (SB) old mice in transplanted recipients (VEH: N = 19; SB: N = 20; three independent experiments) from g normalised to platelet output. Mean values ± s.e.m are shown. *P < 0.05; **P < 0.01 (two-sided Mann–Whitney U-test). Exact P values: PLT: not applicable; ERY: 0.01; MYL: 0.38; BLY: 0.006; TLY: 0.002. P values for the comparison of each lineage output to platelet output for the same condition are also shown: #P < 0.05; ###P < 0.001 (two-sided Mann–Whitney U-test). Exact P values, VEH condition: ERY: 0.36; MYL: 0.02; BLY: 0.0001; TLY: 0.000002. Exact P values, SB condition: ERY: 0.31; MYL: 0.55; BLY: 0.74; TLY: 0.03. Source data are provided as a source data file.

