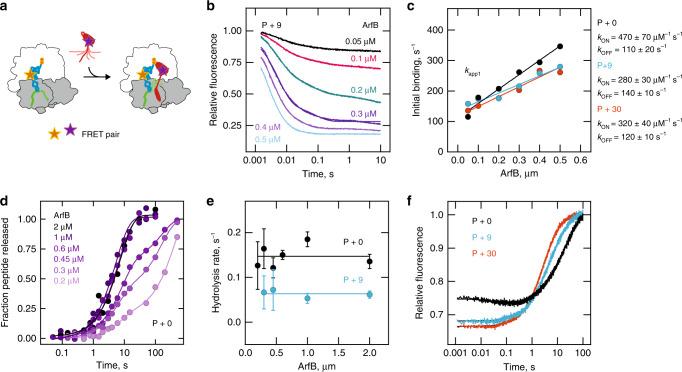
Fig. 4. A dynamic model of ArfB recruitment.
a Experimental assay to monitor binding of ArfB to the ribosome in real time. P + n ribosome complexes containing fluorescein-labeled fMetPhe-tRNAPhe (P + n(Flu)) are mixed with quencher-labeled ArfB (ArfB(540Q)) and fluorescein quenching is monitored in real time in a stopped-flow apparatus. b Time courses of ArfB binding with fixed concentration of P + 9(Flu) (0.015 µM) and increasing concentrations of ArfB(540Q) (0.05-0.5 µM) (20 °C). Lines indicate three-exponential fits. c Kinetics of initial binding of ArfB(540Q) to P + 0(Flu), P + 9(Flu), and P + 30(Flu) complexes. Plotted is the concentration dependence of the apparent rate constant (kapp1) for the predominant association phase in (b). Data represents the mean values of two biological replicates with up to six technical replicates each. The association (kON) and dissociation (kOFF) rate constants are determined by linear fitting of the concentration dependence. Errors of kON and kOFF values are SEM of the fit. d Kinetics of peptidyl-tRNA hydrolysis. Time courses of hydrolysis with P + 0 ribosome complex (0.15 µM) and ArfB (0.2–2 µM) (37 °C). Data represented as mean values of two biological replicates. e Comparison of peptidyl-tRNA hydrolysis rates on P + 0 and P + 9 complexes. Values are obtained by exponential fitting of the rapid phase of the hydrolysis time courses (d and Supplementary Fig. 4f). Error bars represent the SEM of the fit. f Dissociation of ArfB from P + 0, P + 9, and P + 30 complexes. The release of ArfBGAQ(540Q) (0.1 µM) from the pre-hydrolysis complexes P + 0(Flu), P + 9(Flu), and P + 30(Flu) (0.015 µM) was initiated by rapid mixing with unlabeled P + 0 complexes (1 µM) (20 °C).

