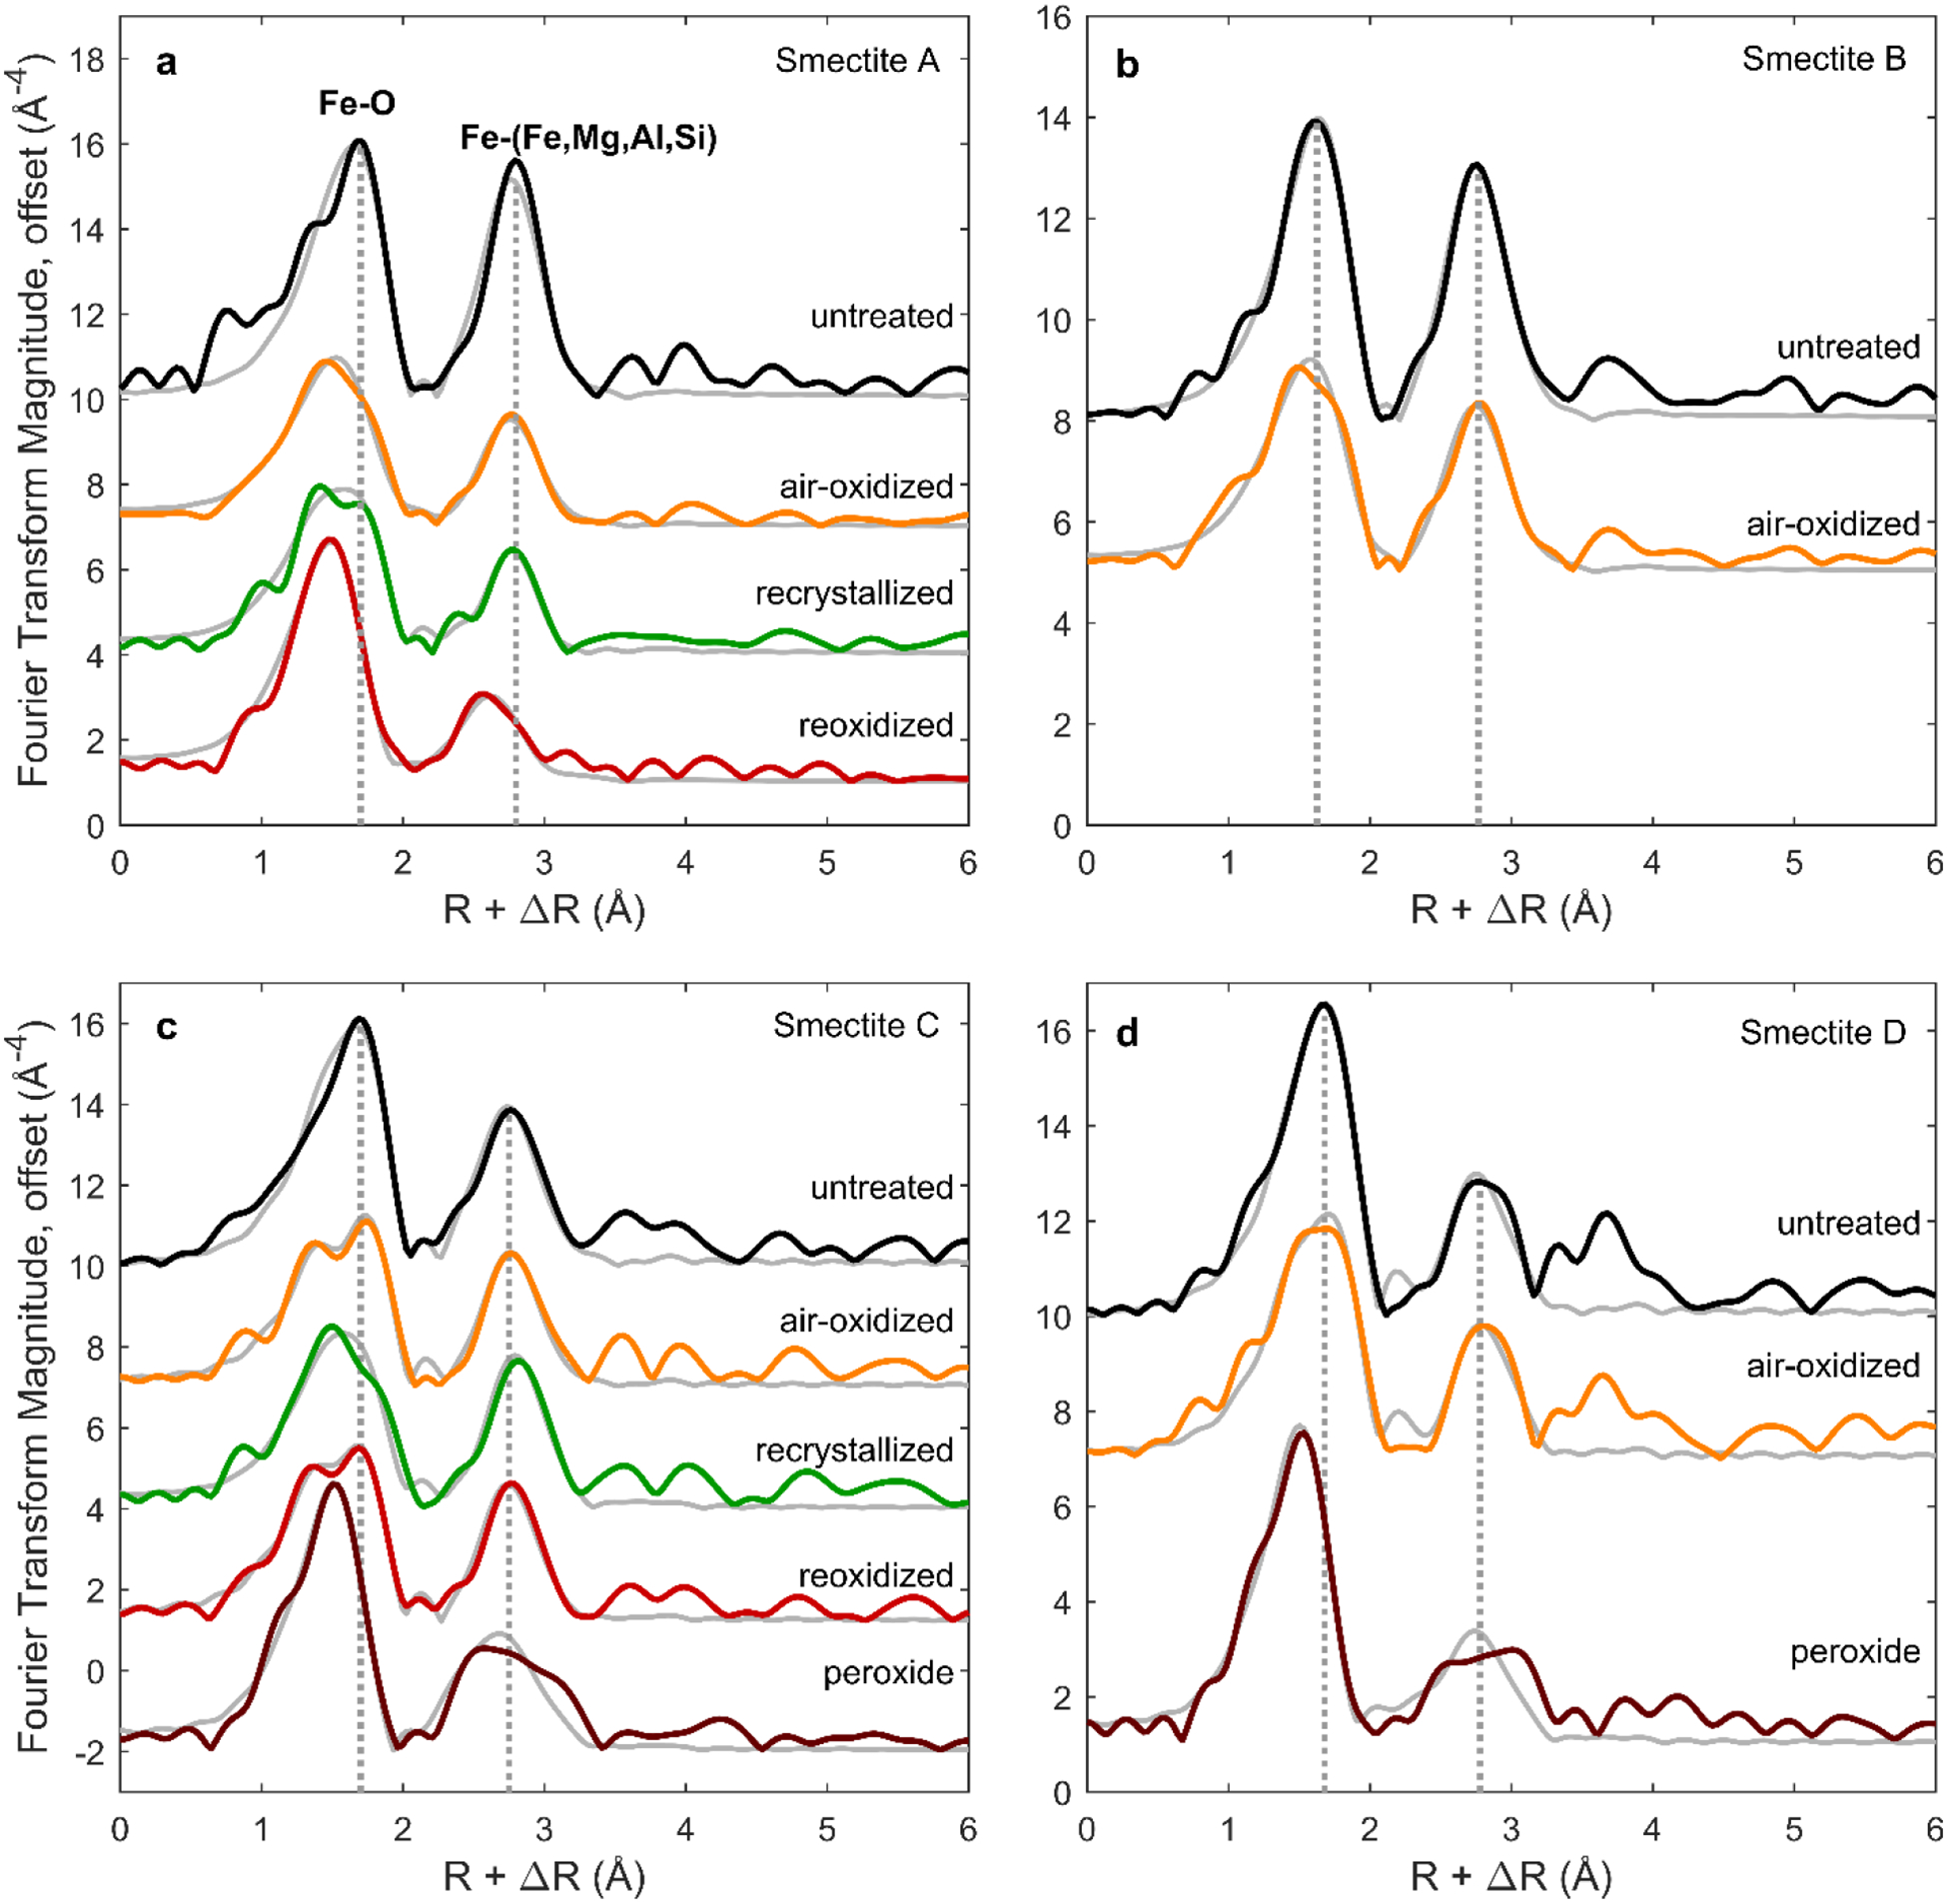
Figure 4.

Fourier transforms of EXAFS spectra, uncorrected for phase shift (ΔR) and offset for clarity. Modeled fits to the EXAFS spectra (gray series) were calculated using the R range from 1 to 3.4 Å. For each composition, dotted lines corresponding to positions of Fe-O and Fe-(Fe,Mg,Al,Si) shells in untreated smectite are included for reference. k3-weighted EXAFS spectra (prior to Fourier transform) are displayed in Figure S2.
