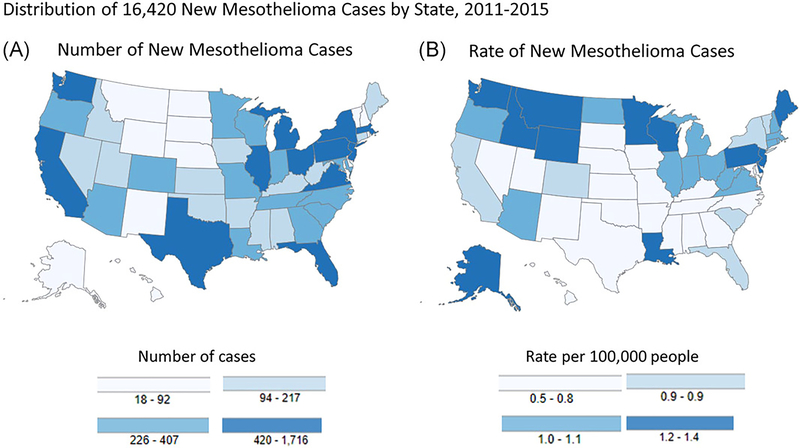
FIGURE 1.
Geographical distribution of new mesothelioma cases (both sexes, all ages, all races, and ethnicities) by state, 2011 to 2015: numbers of cases are depicted in Map A and rates are depicted in Map B. Rates are per 100 000 persons and are age-adjusted to the 2000 US standard population. State rankings based on numbers of cases and incidence rates are different. Source: US Cancer Statistics Working Group1

