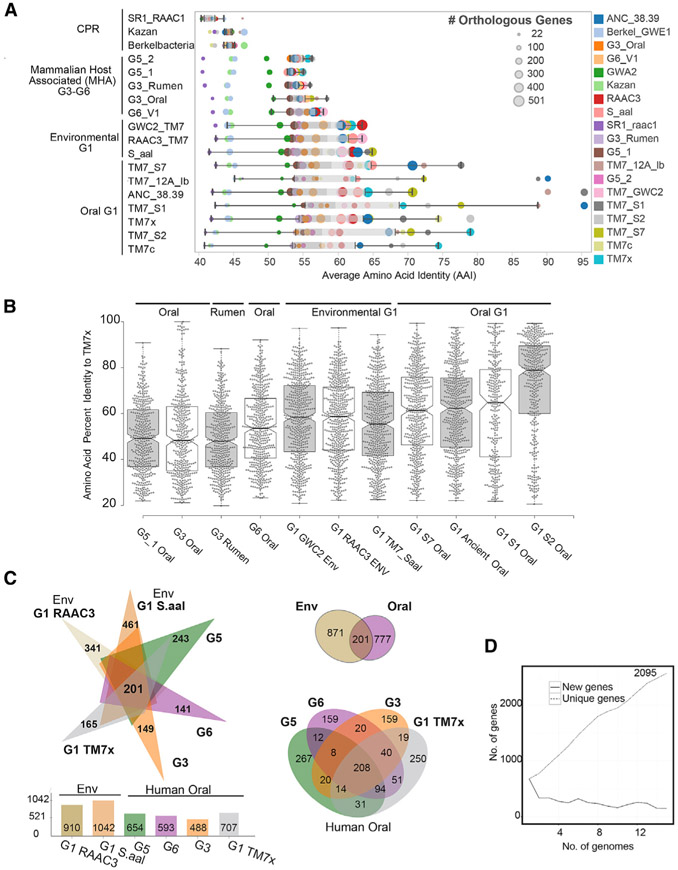
Figure 2. Unexplored Diversity of the Phylum Saccharibacteria.
(A) Relationships between phylogeny with average amino acid identities and number of shared orthologous genes between Saccharibacteria and other divergent phyla highlight the small number of orthologous genes and percentage homology between groups in these reduced genomes (percentage identity cutoff ≥ 20%). Each row is a genome, and each circle is the AAI value between a pair of genomes colored by the genome in comparison. Size of the circle indicates the number of orthologous genes for the pair. (Full table available in Table S4.)
(B) Comparing the percentage identities of the different genomes with the genes found in the cultivated G1 oral strain TM7x, highlighting the overall distribution of amino acid identities across the genome, with higher average percentage identities with the environmental G1 genomes than other oral-derived groups outside of G1. Each dot is an amino acid identity value for the best hit protein in the corresponding genome.
(C) Pangenome analysis of environmental and mammalian host-associated (MHA) groups (excluding the G3 rumen genome). Oral genome comparisons only using the available genomes from each group (G1, G3, G5, and G6) share 208 core genes, with unique genes ranging from 159 to 267 (Tables S5 and S6).
(D) Number of new and unique genes as genomes are added to the Saccharibacteria pangenome.

