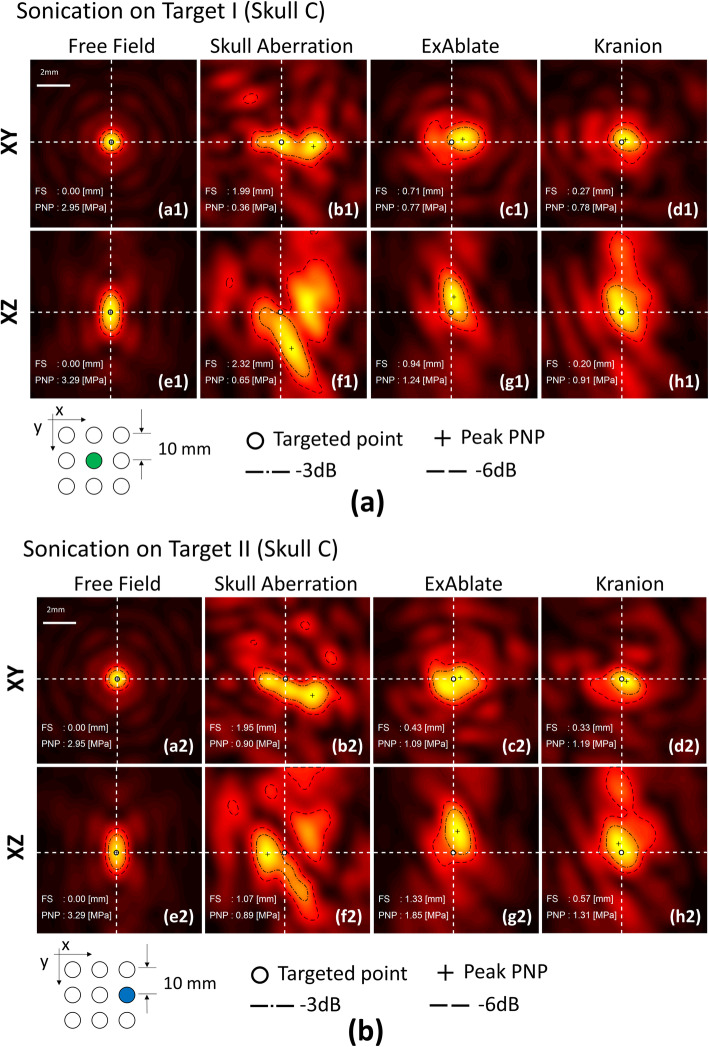
Fig. 2.
Hydrophone 2D scanning maps the human skullcap (Skull C). A 0.25 mm step resolution and 10 mm × 10 mm coverage area were maintained on all of the hydrophone scanned maps. Lateral (XY) and axial (XZ) hydrophone scanning maps based on the focal point (white dot) of the free field sonication were applied. The PNP map was plotted, and the white dashed line that crosses the focal point was illustrated. The peak intensity for each image is normalized for each local peak pixel value. The result for skull A and B were shown in additional files 1 and 2, respectively

