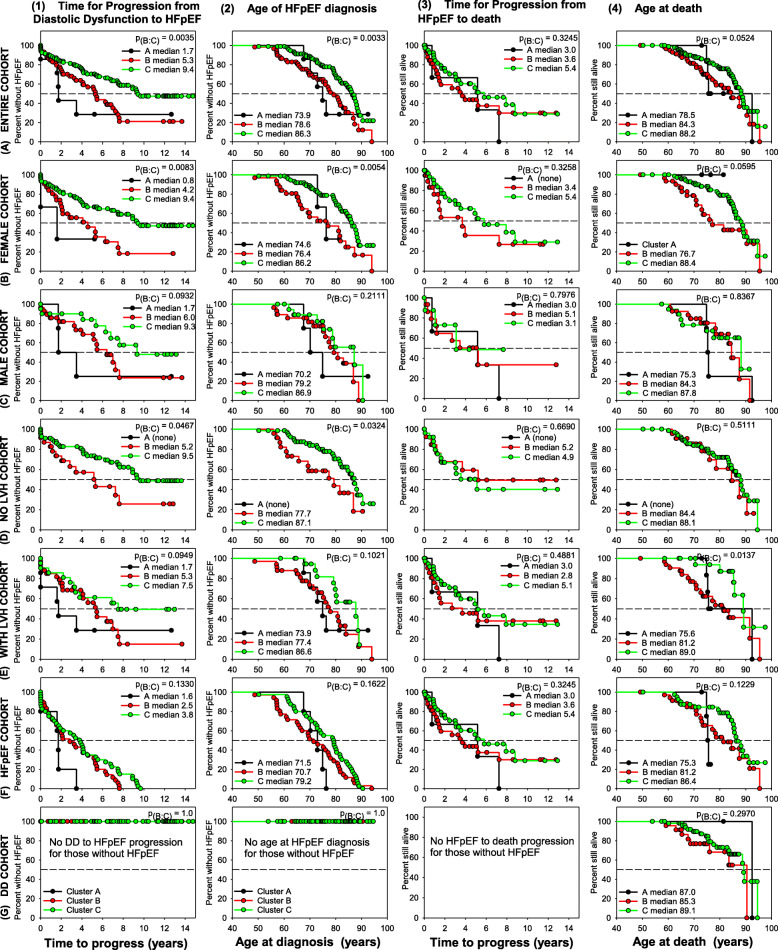
Fig. 2.
Summary of significant Kaplan-Meier differences among Clusters. Kaplan-Meier estimates for the (1) time (years) from the initial diagnosis of subclinical diastolic dysfunction (DD) to HFpEF (left column), (2) age of HFpEF diagnosis, (3) time (years) from the development of HFpEF to death from all causes, and (4) age of death (right column). Each graph shows comparisons among the three Clusters A (black), B (red), and C (green). Kaplan-Meier analysis was performed on the (A) entire cohort, (B) female only cohort (C) male only cohort (D) all patients without left ventricular (LV) hypertrophy (E) all patients with LV hypertrophy (F) all patients who developed HFpEF and (G) all patients who remained with subclinical diastolic dysfunction (DD). P values = Cluster B versus Cluster C

