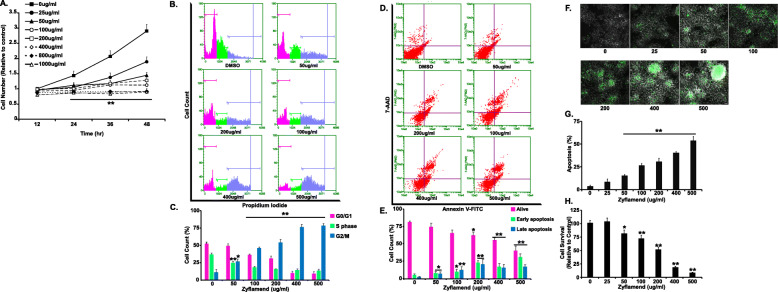
Fig. 1.
Zyflamend Reduces Cell Survival and Induces Cell Death of Pancreatic Cancer Cells in a Dose Dependent Manner. a Effects of Zyflamend on cell survival and proliferation: cells were treated with increasing doses of Zyflamend for 24 h. Line graphs represent the intensity of SRB staining reflective of the cell number and presented as means + SEM. b-c Cell cycle analysis and assessment of DNA content in β-TC6 cells treated with DMSO (control) or the indicated concentration of Zyflamend for 24 h. Representative histogram distributions for each treatment are shown. c Bar graphs represent the percentages of cells in each phase of the cell cycle, which were estimated using the GuavaSuite Software package and are presented as means + SEM from three independent experiments. *p < 0.05, **p < 0.01 indicate significant difference between the indicated concentration and control cells treated with the vehicle DMSO. d-e Zyflamend treatment induces apoptosis in β-TC6 Cells: 50% confluent cells were treated with increasing concentrations of Zyflamend, and then labeled with Annexin V-FITC and 7-AAD. Representative dot plots are shown. Annexin V positive and /7-AAD negative cells (lower right quadrants) represent early stages of apoptosis, whereas cells that are positive for both Annexin V and 7-AAD (upper right quadrants) are in late stages of apoptosis. e Bar graphs represent live, early, and late apoptotic cells are presented as means + SEM of at least three independent experiments. *p < 0.05, **p < 0.01 indicate significant difference between the indicated concentration of Zyflamend and control cells treated with the vehicle DMSO. f-g Chromatin condensation in cells treated with increasing doses of Zyflamend for 24 h. Representative images are shown. Scale bar: 50 μm. g Bar graphs represent the number of apoptotic cells (Hoechst positive) as means + SEM. of at least three independent experiments. h Cell toxicity assay using the MTT method. Bar graphs represent the intensity of formazan (produced from MTT by viable cells) staining reflective of the cell number and presented as means + SEM. of at least three independent experiments. In g and h *p < 0.05, **p < 0.01 indicate a significant difference between cells treated with Zyflamend and non-treated cells

