Fig. 2.
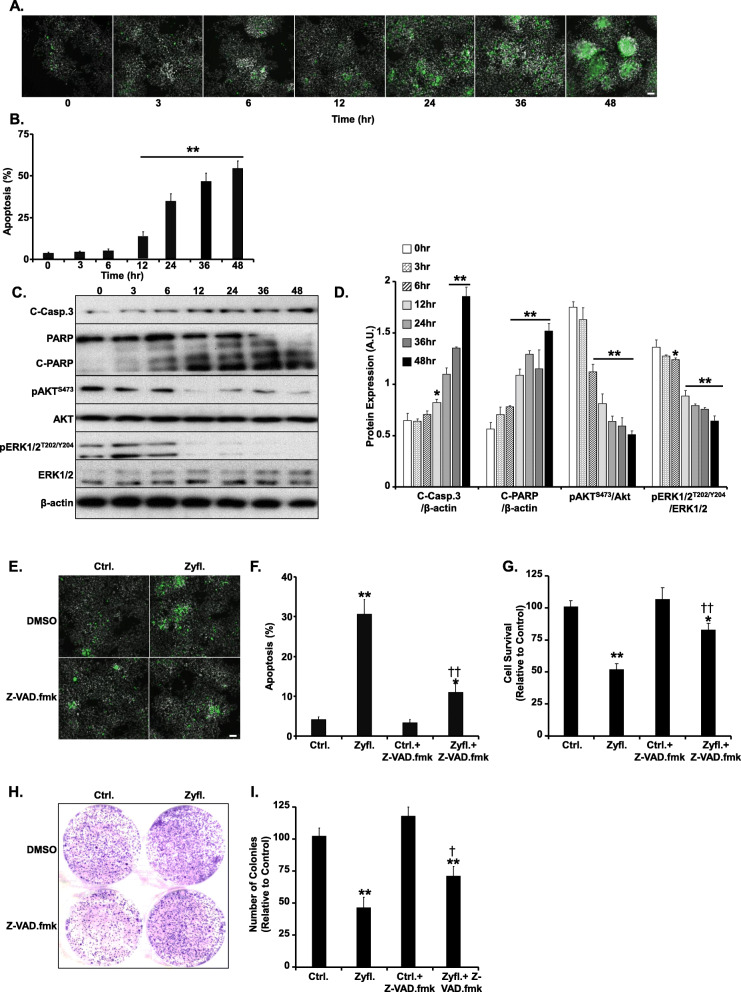
Zyflamend Induces Apoptotic Cell Death in β-TC6 Cells. a-b Effects of Zyflamend on chromatin condensation. Cells were treated with Zyflamend (200 μg/ml) for the indicated time and chromatin condensation was evaluated by fluorescence microscopy using Hoechst 33258. Representative images are shown. Scale bar: 50 μm. b Bar graphs represent the number of apoptotic cells (Hoechst positive) as means + SEM. **p < 0.01 indicates a significant difference between cells treated with Zyflamend and non-treated cells. c-d Immunoblots of key proteins in cell survival and apoptosis markers in cells treated with 200 μg/ml of Zyflamend for the indicated time. d Bar graphs represent cleaved caspase-3 (C-Casp. 3)/β-actin, cleaved PARP (C-PARP)/β-actin, pAKT/AKT, and pERK/ERK, as means + SEM. *p < 0.05, **p < 0.01 indicates a significant difference between cells treated with Zyflamend and non-treated cells. e-f Chromatin condensation in β-TC6 cells treated with 200 μg/ml Zyflamend with and without the pan-caspase inhibitor Z-VAD.fmk. Representative images are shown. Scale bar: 50 μm. f Bar graphs represent the number of apoptotic cells (Hoechst positive) as means + SEM. g Cell toxicity assay using the MTT method. Bar graphs represent the intensity of formazan staining reflective of the cell number and presented as means + SEM. h-i Colony formation assay. i Bar graphs represent the relative number of colonies in each condition determined by dividing the number of colonies for a given treatment by the total number of colonies in DMSO treated cells (Ctrl.) and expressed as a percentage. In g and i, *p < 0.05, **p < 0.01 indicate a significant difference between cells treated with Zyflamend and non-treated cells. †p < 0.05, ††p < 0.01 indicate a significant difference between cells treated with Z-VAD.fmk and non-treated

