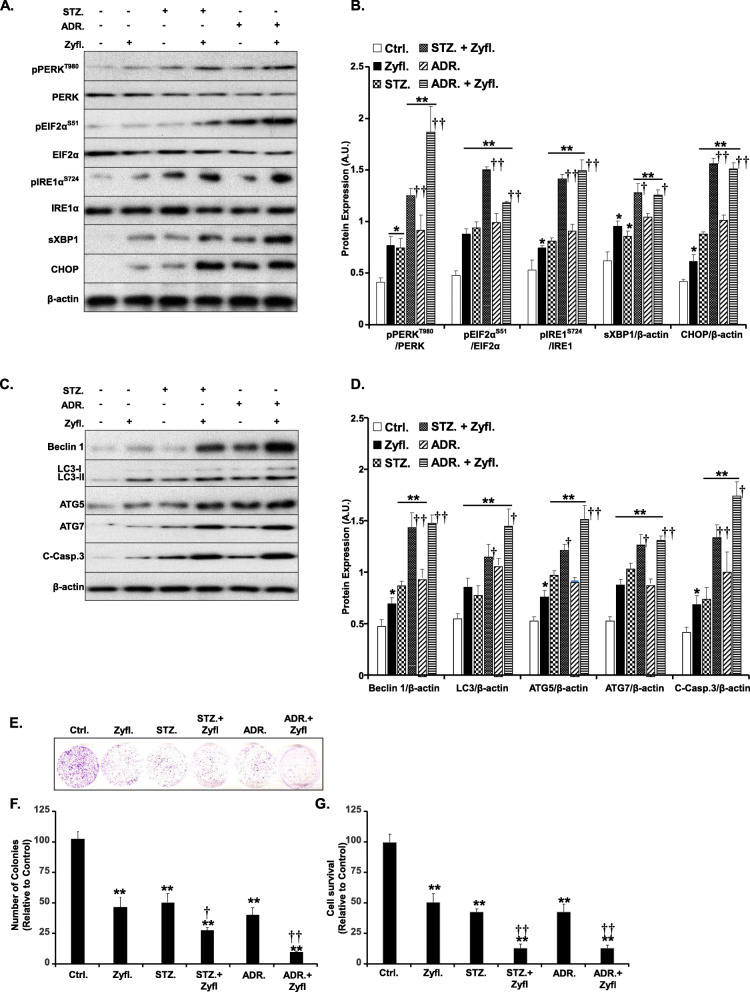
Fig. 6.
Zyflamend Exacerbates the Effects of Streptozotocin and Adriamycin on ER Stress, Autophagy, and Cell Death in β-TC6 Cells. Total cell lysates from control cells treated with Zyflamend and non-treated cells with or without streptozotocin (STZ; 5 mM) or adriamycin (ADR; 5 μM) for 24 h were immunoblotted for markers of ER stress (a-b), autophagy, and cell death (c-d). Representative immunoblots are shown. b Bar graphs represent pPERK/PERK, pEIF2α/EIF2α, pIRE1/IRE1, sXBP1/β-actin, and CHOP/β-actin as means + SEM. d Bar graphs represent Beclin 1/β-actin, LC3/β-actin, ATG5/β-actin, ATG7/β-actin, and cleaved caspase-3 / β-actin as means + SEM. e-f Colony formation assay. f Bar graphs represent the relative number of colonies in each condition determined by dividing the number of colonies for a given treatment by the total number of colonies in DMSO treated cells (Ctrl.) and expressed as a percentage. g Cell toxicity assay using the MTT method. Bar graphs represent the intensity of formazan staining reflective of the cell number and presented as means + SEM. In b, d, f and g, *p < 0.05, **p < 0.01 indicate a significant difference between cells treated with Zyflamend and non-treated cells. †p < 0.05, ††p < 0.01 indicate a significant difference between cells treated with Zyflamend combined with the chemotherapeutic agents (streptozotocin or adriamycin) and cells treated with streptozotocin or adriamycin only

