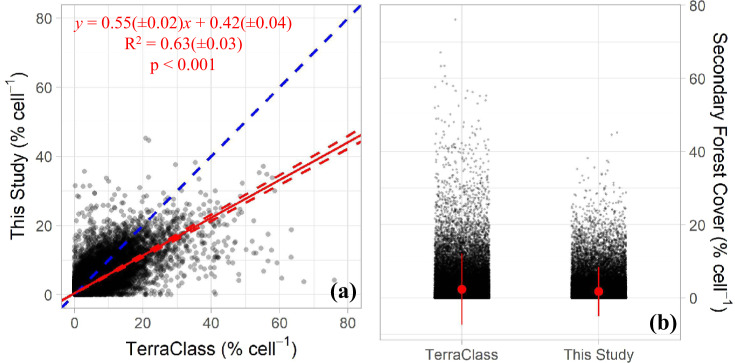
Fig. 4.
(a) Scatter-plot for the relationship between the proportion of the secondary forest within the 10 by 10 km cells in the two datasets. The dashed blue line is the 1:1 line; the red line is the average regression from the bootstrap approach with 10,000 interactions; the dashed red lines are regressions using the standard deviation values of the equation parameters. All p-values from the 10,000 bootstrap interactions were lower than 0.001. (b) Jitter-plot for the proportion of the secondary forest within the 10 by 10 km cells. The red dot is the mean, and the red vertical line the standard deviation.

