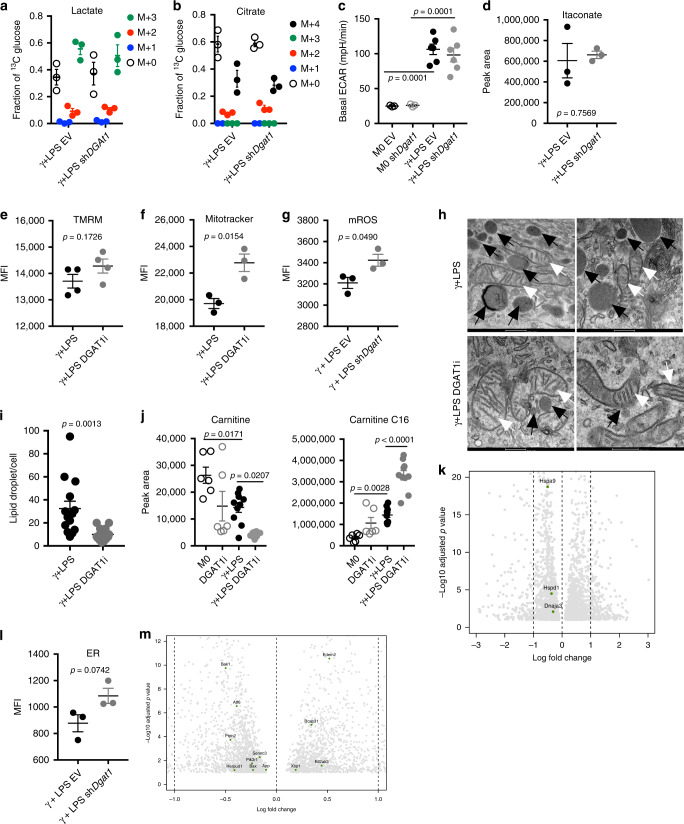
Fig. 3. The lack of effect of the loss of function of DGAT1 on core metabolism in inflammatory macrophages.
a Fraction contribution of glucose carbons into lactate and b citrate, in macrophages transduced with EV or shDgat1, stimulated with IFNγ + LPS for 18 h and cultured in 13C-glucose for the entire time (n = 3 biologically independent samples). c Basal ECAR of transduced macrophages cultured with IFNγ + LPS or without (M0) for 18 h (M0 n = 3, γ + LPS n = 6 biologically independent samples). d Total pool of itaconate in transduced macrophages cultured with IFNγ + LPS or without (M0) for 18 h (n = 3 biologically independent samples). e Effects of DGAT1 loss of function on mitochondrial membrane potential (n = 4 biologically independent samples), f mitochondrial mass and g mitochondrial reactive oxygen species after stimulation with IFNγ + LPS for 18 h (n = 3 biologically independent samples), (MFI, median fluorescence intensity). h Electron microscopy of macrophages at 18 h post stimulation with IFNγ + LPS without or with DGAT1i. Black arrows, LDs; white arrows, mitochondria (scale bars represent 500 nm). i LD/cell count fom electron microscopy (n = 14 cells from 3 biologically independent samples). j Carnitine and C16-acylcarnitine in resting (M0) or IFNγ + LPS-stimulated macrophages, cultured with or without DGAT1i for 18 h (M0 n = 6, DGAT1i n = 6, γ + LPS n = 10, γ + LPS DGAT1i n = 10 biologically independent samples). k Mitochondrial unfolded protein response genes at 18 h post stimulation with IFNγ + LPS without or with DGAT1i as measured using RNAseq (Log2 Fold change). l Endoplasmic reticulum (ER) mass in transduced macrophages stimulated with IFNγ + LPS for 18 h (n = 3 biologically independent samples). m ER stress response genes at 18 h post stimulation with IFNγ + LPS without or with DGAT1i as measured using RNAseq (Log2 Fold change). Data are represented as mean values ± s.e.m. One-way ANOVA with Bonferroni’s multiple comparison test (a–c, j); Unpaired two-tailed Student’s t test (d, e, g, i, l). h–i, k, m representative of one experiment, a–g, j, l representative of three experiments. Source data are provided as a Source Data file.

