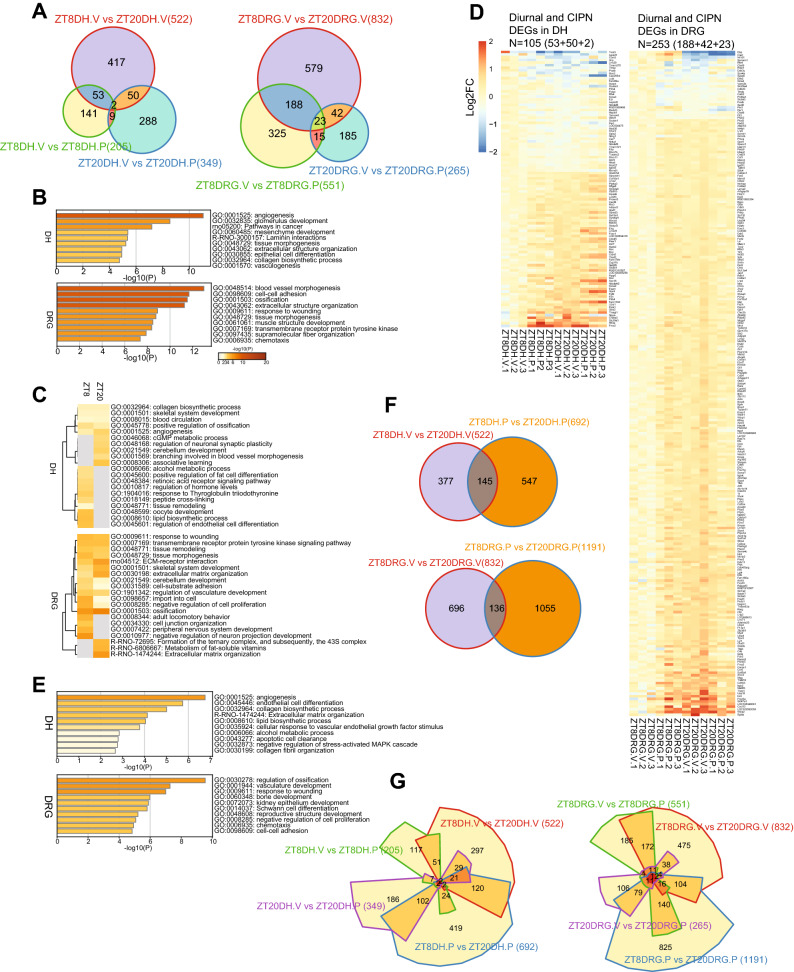
Figure 5.
Circadian transcriptomic landscape in the DRG and the DH. The differentially expressed genes were determined by using DESeq2 with thresholds of p < 0.05 and fold change > 1.2. (A) Venn diagrams of differentially expressed genes in vehicle and paclitaxel treated DH (left panel) and DRG (right panel). “ZT8DH.V vs. ZT20DH.V” (522) and “ZT8DRG.V vs. ZT20DRG.V” (832): Red circles indicate differentially expressed genes (DEGs) at two circadian time points (ZT8 and ZT20) in DH and DRG respectively. “ZT8DH.V vs. ZT8DH.P” (205) indicates paclitaxel-induced DEGs at ZT8 (green circle) and “ZT20DH.V vs. ZT20DH.P” (349) indicates paclitaxel-induced DEGs at ZT20 (blue circle) in the DH (left panel). “ZT8DRG.V vs. ZT8DRG.P” (551) indicates paclitaxel induced DEGs at ZT8 (green circle) and “ZT20DRG.V vs. ZT20DRG.P” (265) indicates paclitaxel induced DEGs at ZT20 in DRG (blue circle). (B) Heat map showing the top enrichment clusters by Metascape analysis (https://metascape.org/) using diurnal DEGs in the DH and the DRG. (C) Heat map showing the top enrichment clusters by Metascape analysis using paclitaxel-induced CIPN DEGs in the DH and the DRG at two circadian time points (ZT8 and ZT20). (D) Heat map view of DEGs at the intersection of diurnal genes and CIPN DEGs in the DH and the DRG. Each gene is represented as a horizontal line ordered vertically by log2 fold change in expression level at ZT20 with vehicle treatment relative to ZT8. (E) Heat map showing the top enrichment clusters by Metascape analysis using the overlapped genes between diurnal DEGs and paclitaxel-induced CIPN DEGs. Discrete color scale represents statistical significance, while gray color indicates a lack of significance. (F) Venn diagrams of diurnal DEGs in vehicle and paclitaxel-induced DEGs in DH (upper panel) and DRG (lower panel). Red circle: diurnal DEGs, blue circle: paclitaxel induced diurnal DEGs. (G) Chow-Ruskey diagrams showing the four-way overlap of diurnal DEGs, CIPN DEGs (ZT8 and ZT20) and paclitaxel-induced DEGs in both tissues. The boundaries for each DEGs are color-coded: diurnal DEGs (red), CIPN DEGs at ZT8 (green) and ZT20 (purple) and paclitaxel-induced DEGs (blue). The domain areas are proportional to the number of DEGs. The Venn diagrams, heat maps for gene expression and Chow-Ruskey diagrams were prepared with R version 3.6.3 (https://github.com/js229/Vennerable, https://CRAN.R-project.org/package=pheatmap).

