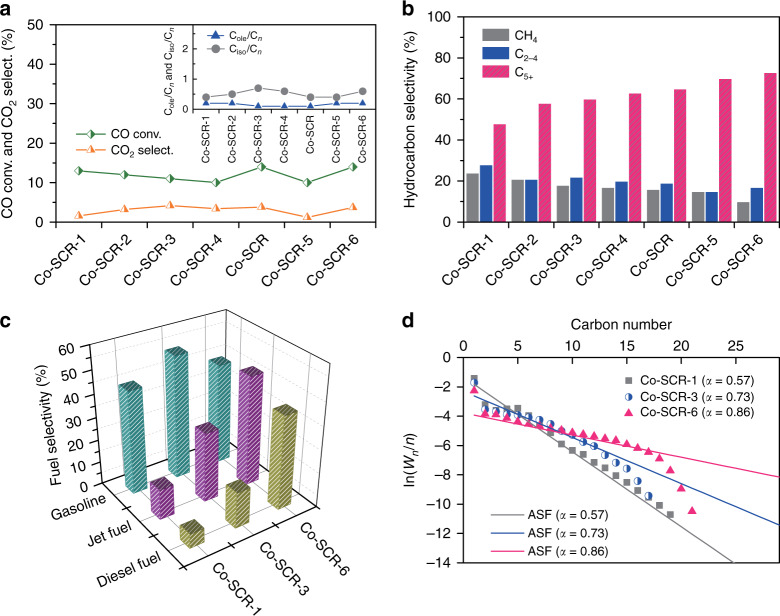
Fig. 4. Impact of geometrical structures on FT product distribution.
a CO conversion, Cole/Cn ratio and Ciso/Cn ratio of the Co-SCRs. b Hydrocarbon distribution of the Co-SCRs. c Fuel selectivity of gasoline (C5–11), jet fuel (C8–16), and diesel fuel (C10–20) for the Co-SCR-1, Co-SCR-3, and Co-SCR-6. d Chain growth probability (α) of the Co-SCRs. The α value was calculated based on the growth trend of hydrocarbons C5–11 over the Co-SCR-1, Co-SCR-3, and Co-SCR-6, respectively. The calculation rule of the α value was according to the Anderson–Schulz–Flory model63,64. Reaction conditions: T = 533 K; P = 2.0 MPa; H2/CO = 2.0; flow rate, 20 ml min−1; time on stream, 10 h.

