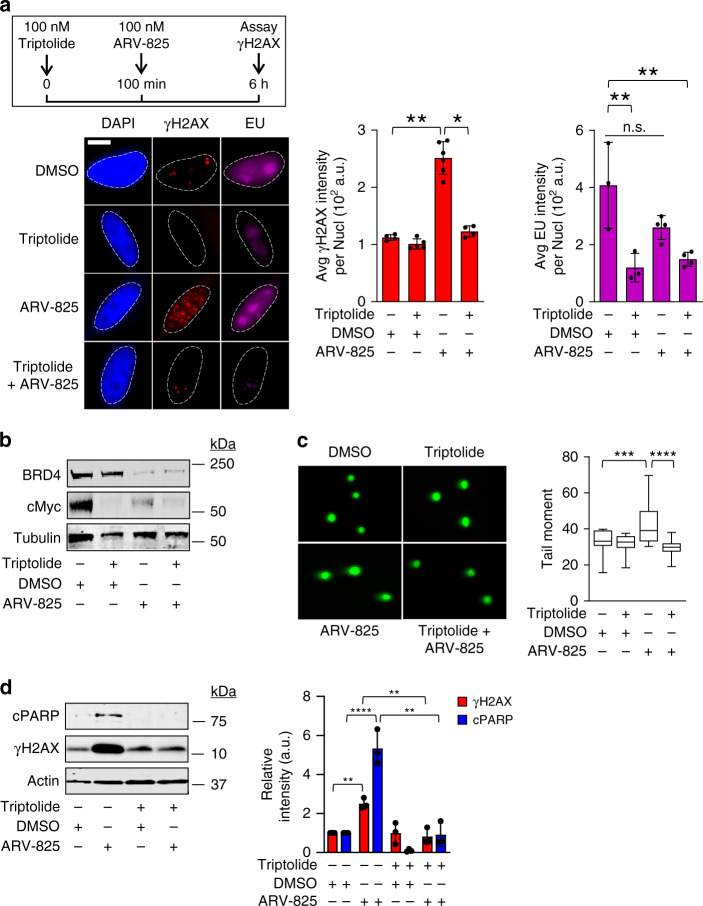
Fig. 2. DNA damage caused by BRD4 degradation requires active transcription.
a Top right: schematic of triptolide/ARV-825 co-treatment experiment in HeLa cells. Bottom right: representative IF images of HeLa cells following treatment with triptolide and/or ARV-825. EU incorporation was used to assess RNA synthesis. Left: Quantification of integrated γH2AX and EU intensity per nucleus quantified from >300 cells as in Fig. 1a (n = 3). Significance assessed using ANOVA followed by Tukey’s test (γH2AXDMSO vs ARV-825 **Adjusted P = 0.0038; γH2AXTriptolide vs Triptolide + ARV *Adjusted P = 0.0139; EUDMSO vs Triptolide **Adjusted P = 0.0041; EUDMSO vs Triptolide + ARV-825 **Adjusted P = 0.0055). Scale bar = 2.5 μm. b Lysates of cells treated with triptolide and/or ARV-825 were analyzed for BRD4 and cMyc levels by WB. c Representative fluorescence microscopy images of neutral comet single cell gel electrophoresis assay after triptolide and/or ARV-825 treatment. Box-whisker plots drawn as in Fig. 1b (n = 3). Significance assessed using ANOVA followed by Tukey’s test, ***Adjusted P = 0.0002, ****Adjusted P < 0.0001. d Lysates from cells pretreated with triptolide followed by co-treatment with ARV-825 were analyzed for γH2AX and cPARP by WB. Relative intensity of bands was quantified (n = 3). Significance assessed using ANOVA followed by Tukey’s test (γH2AXDMSO vs ARV-825 **Adjusted P = 0.0051; γH2AXARV-825 vs Triptolide + ARV-825 **Adjusted P = 0.0019; cPARPDMSO vs ARV-825 ****Adjusted P < 0.0001; cPARPARV-825 vs Triptolide + ARV-825 ****P < 0.0001). b-d are representative gels and images from the same experiment. Data in a, d presented as mean ± SEM. Source data are provided as a Source data file.

