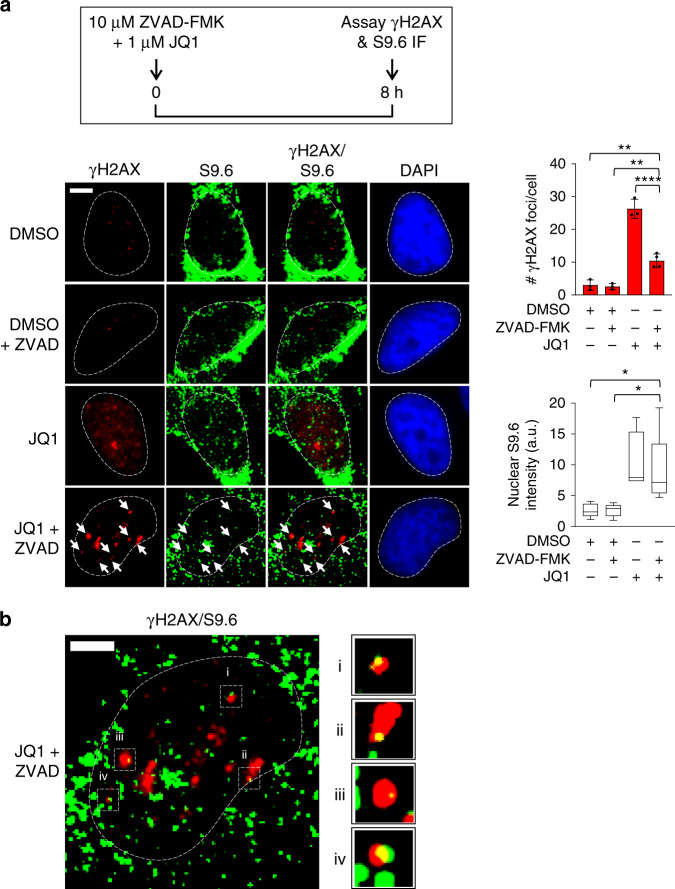
Fig. 6. DNA damage occurs at a subset of R-loops in cells following BRD4 inhibition.
a Upper panel: experimental design. Lower left panel: IF images of γH2AX and S9.6 fluorescence in HeLa cells treated with 10 μM ZVAK-FMK, 1 μM JQ1, or co-treated for 8 h. Lower right panel: quantification of γH2AX foci and nuclear S9.6 intensity per cell. Data presented as mean ± SEM (n = 3 separate experiments). Significance assessed using ANOVA followed by Tukey’s test (γH2AXDMSO vs ZVAD-FMK + JQ1 **Adjusted P = 0.0044; γH2AXZVAD-FMK + DMSO vs ZVAD-FMK + JQ1 **Adjusted P = 0.0031; γH2AXJQ1 vs ZVAD-FMK + JQ1 ****Adjusted P < 0.0001; S9.6DMSO vs ZVAD-FMK + JQ1 *Adjusted P = 0.0444; S9.6ZVAD-FMK + DMSO vs S9.6ZVAD-FMK + JQ1 *Adjusted P = 0.0838). Box-whisker plots are drawn as in Fig. 1b. Scale bar = 2.5 μm. b Enlarged image of a cell treated with ZVAK-FMK and JQ1 showing a subset of co-localizing nuclear γH2AX and S9.6 foci (magnified panels i–iv). Scale bars = 1 μm. Source data are provided as a Source data file.

