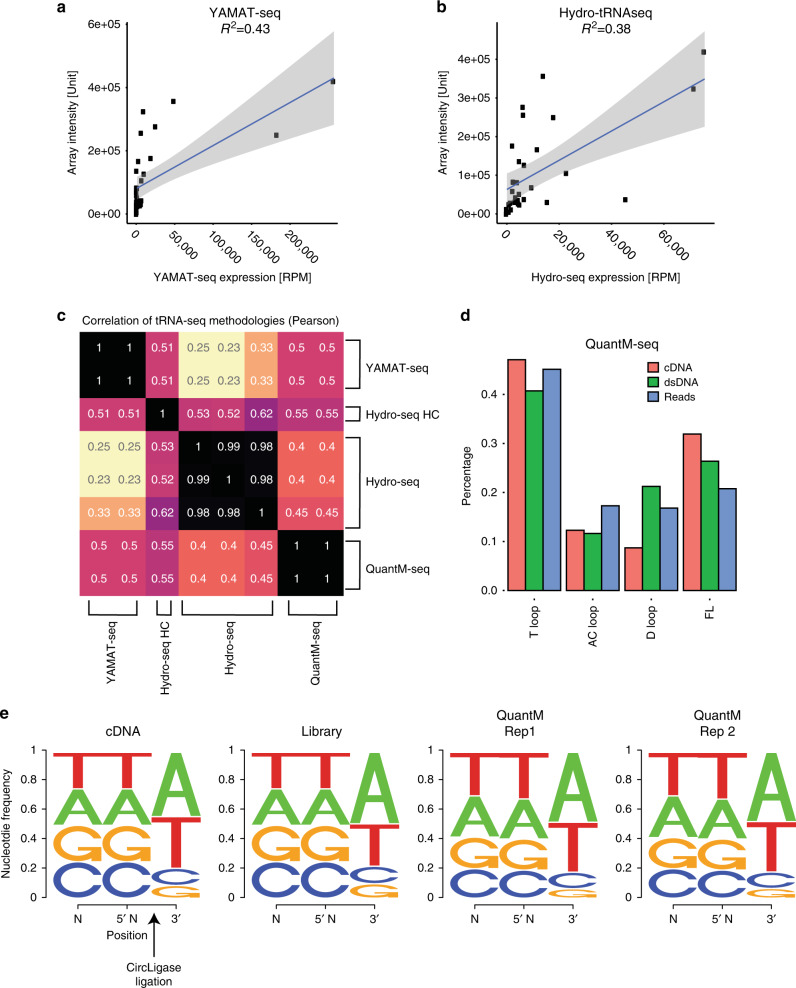
Fig. 2. Comparison of QuantM-seq with other tRNA-seq protocols.
a Scatter plot of reads per million derived from YAMAT-seq versus array intensities derived from densitometry with a fitted linear trendline. Shaded area represents the 95% confidence interval of the linear trendline. b Scatter plot of reads per million derived from Hydro-tRNA-seq versus array intensities derived from densitometry with a fitted linear trendline. Shaded area represents the 95% confidence interval of the linear trendline. c Pearson correlation coefficients between tRNA gene-level expression for each dataset. Hydro-seq HC denotes the high coverage library from ref. 24. d Bar chart depicting the average percentage of cDNA, dsDNA, or reads representing reverse transcriptase stalling or fall-off in the T-loop, anticodon (AC) loop, D-loop, or at the end of tRNA (full length; FL). Values were calculated from cDNA gel, Bioanalyzer trace, or reads respectively for N = 2 biological replicates in HEK293 cells. e Sequence logos showing the fraction of DNA bases near CircLigase ligated bases as inferred from cDNA gels (cDNA) or Bioanalyzer trace (Library), or calculated from reads (QuantM Rep 1 and QuantM Rep 2). See “Methods” for detailed calculations. Source data are provided as a Source Data file.

