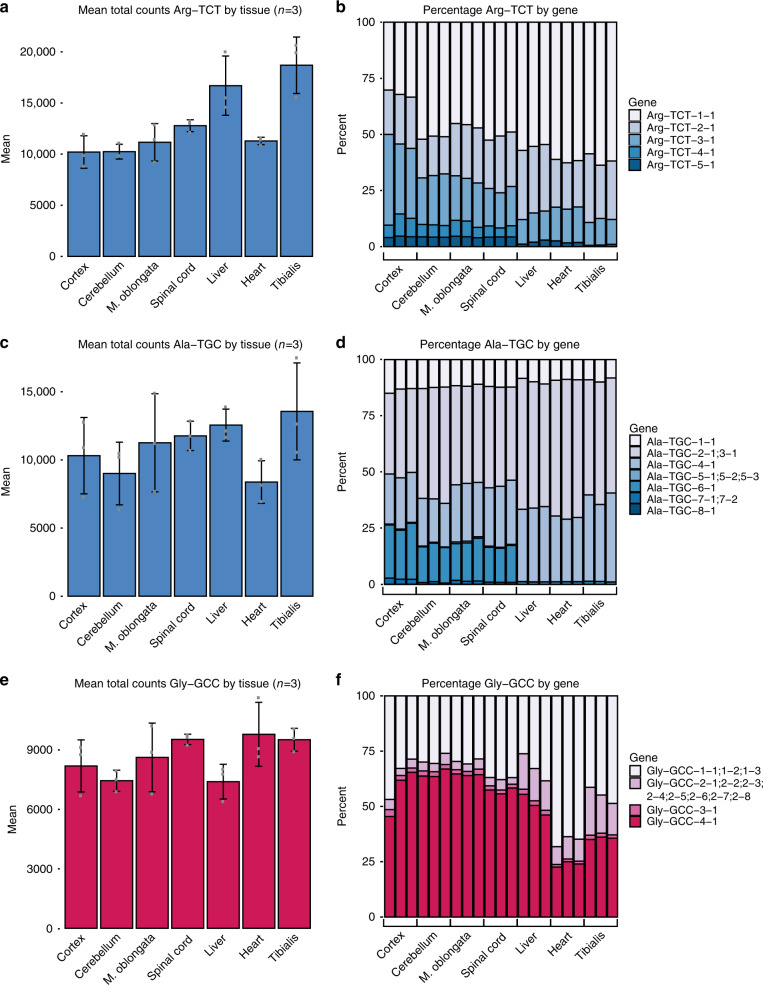
Fig. 5. Isodecoder pools comprising anticodon pools differ across tissues.
Bar charts with center showing mean total Arg-TCT (a), Ala-TGC (c), or Gly-GCC (e) reads per million across mouse tissues. Error bars represent the standard deviation of N = 3 biological replicates. Stacked bar charts for percentage of each isodecoder contributing to the pool of Arg-TCT (b), Ala-TGC (d), or Gly-GCC (f) across mouse tissues. Bar charts with blue shading represents examples of anticodon pools with CNS-enriched isodecoders. Red shading represents an example of an anticodon pool with non-CNS-enriched isodecoders.

