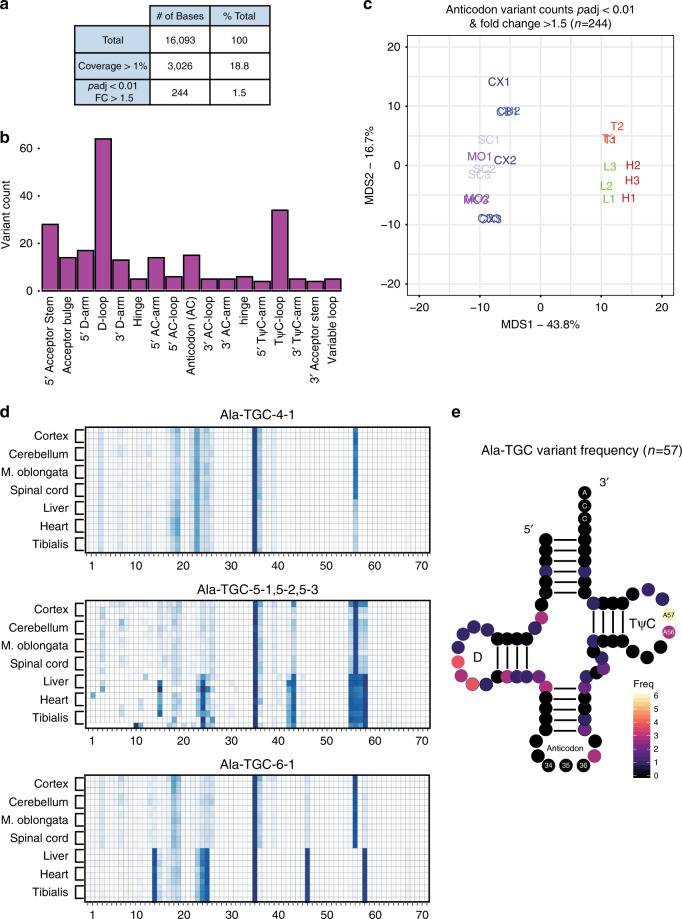
Fig. 6. Variants in sequencing change across tissues in tRNA regions known to be modified.
a Tabulation of QuantM-seq variant analyses. Total represents the total number of bases in gtRNAdb mouse tRNAs. Coverage > 1% represents the number of bases that have a variant fraction (variant count / read coverage) of at least 1% across all tissue samples. The last row represents bases that are at least 1% variant fraction, change with padj < 0.01 (Two-tailed, Benjamini–Hochberg), and exhibit an absolute fold-change of >1.5 across mouse tissues. b Histogram of significantly changed tRNA bases across seven tissues in mouse. All variant bases are binned by tRNA features. c Multidimensional scaling plot indicating distance between tissue samples with regards to differential variant fractions across tissues (Euclidean distance). CNS tissues are labeled in shades of blue, non-CNS muscle tissues are in red, and the non-CNS liver is in green. d Heatmaps for three isodecoders representing variant fractions at each tRNA position (x-axis) across each tissue sample (y-axis). The numbers below the plot indicate nucleotide position. e Two-dimensional representation of the Ala-TGC isoacceptor class showing counts of differential variants by position (n = 11 isodecoders).

