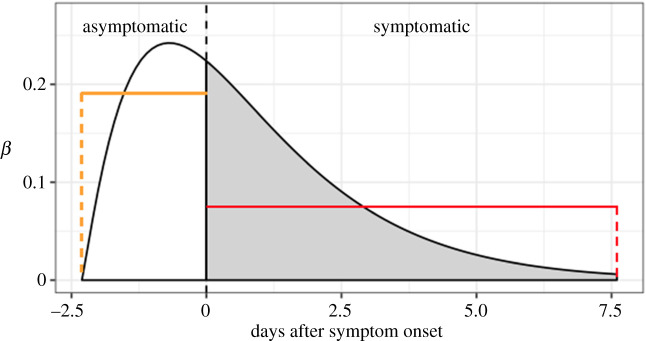
Figure 1.
Distribution of asymptomatic and symptomatic infectiousness of COVID-19-infected individuals, used in the branching process [39]. Horizontal lines show the average infectiousness per time unit for the asymptomatic stage (orange) and the symptomatic stage (red).

