
Figure 8.
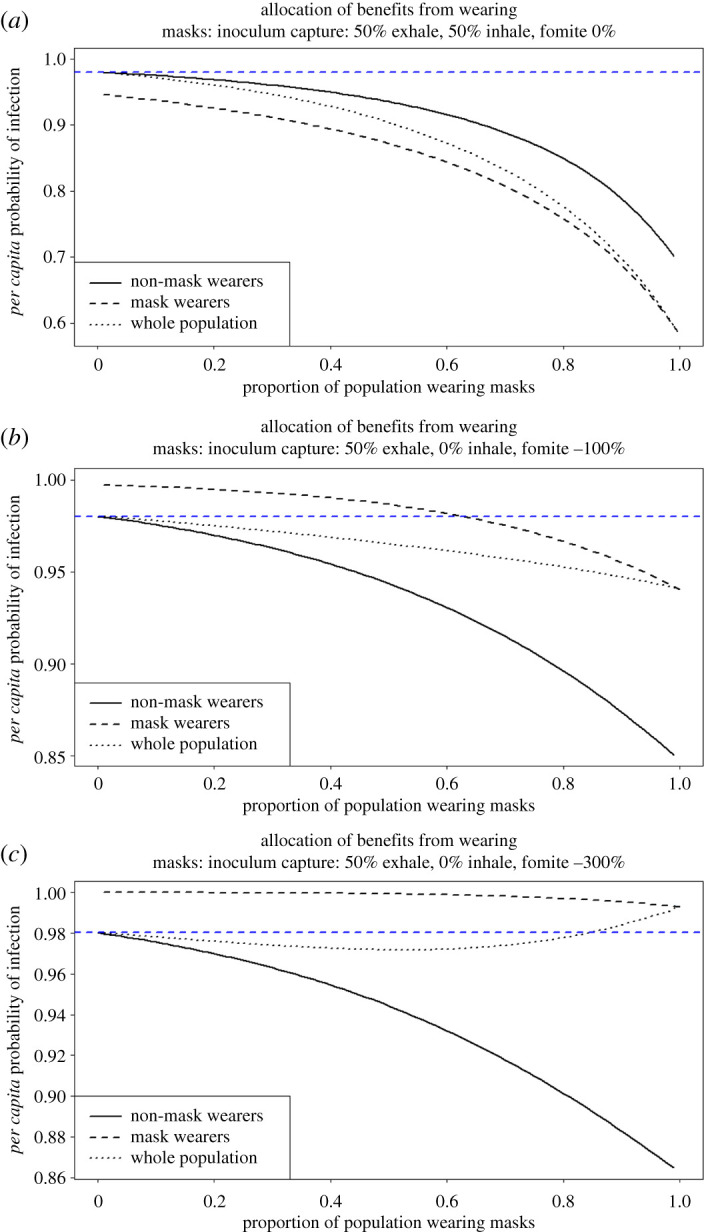
The per capita probability of infection in relation to the proportion of the population wearing facemasks and the negative effects of fomite infection, owing to poor compliance. The blue dashed line represents the individual probability of infection when no one wears a facemask. (a) When the fomite parameter is at 0% and droplet exhalation and inhalation are both reduced by 50% for facemask wearers (good compliance and facemask), facemask wearers benefit more than non-facemask wearers and the probability of infection drops with increasing proportion of the population wearing facemasks, and is always lower for both facemask wearers and non-wearers than if nobody wears a mask. (b) When facemask wearing incurs a susceptibility penalty, with the fomite susceptibility increased by 100% and a 50% reduction in droplet exhalation, but no effect on droplet inhalation (bad compliance and facemask), there is a net benefit to the population, but the mask wearers are personally worse off until about 65% of the population is wearing them, when even the facemask wearers become better off than if nobody wears facemasks. (c) When compliance and facemask usage are very bad (fomite susceptibility increase of 300% and 50% droplet exhalation reduction), non-facemask wearers are at an advantage but, counterintuitively, until about 80% facemask adoption, there is still a small net benefit to the population as a whole, although a larger benefit to non-mask wearers. Note the different axis scales in each subplot, e.g. the facemasks in (a) are able to deliver a 40% reduction in population-level risk, while the facemasks in (b,c) are only able to deliver up to a 15% reduction, to a portion of the population.