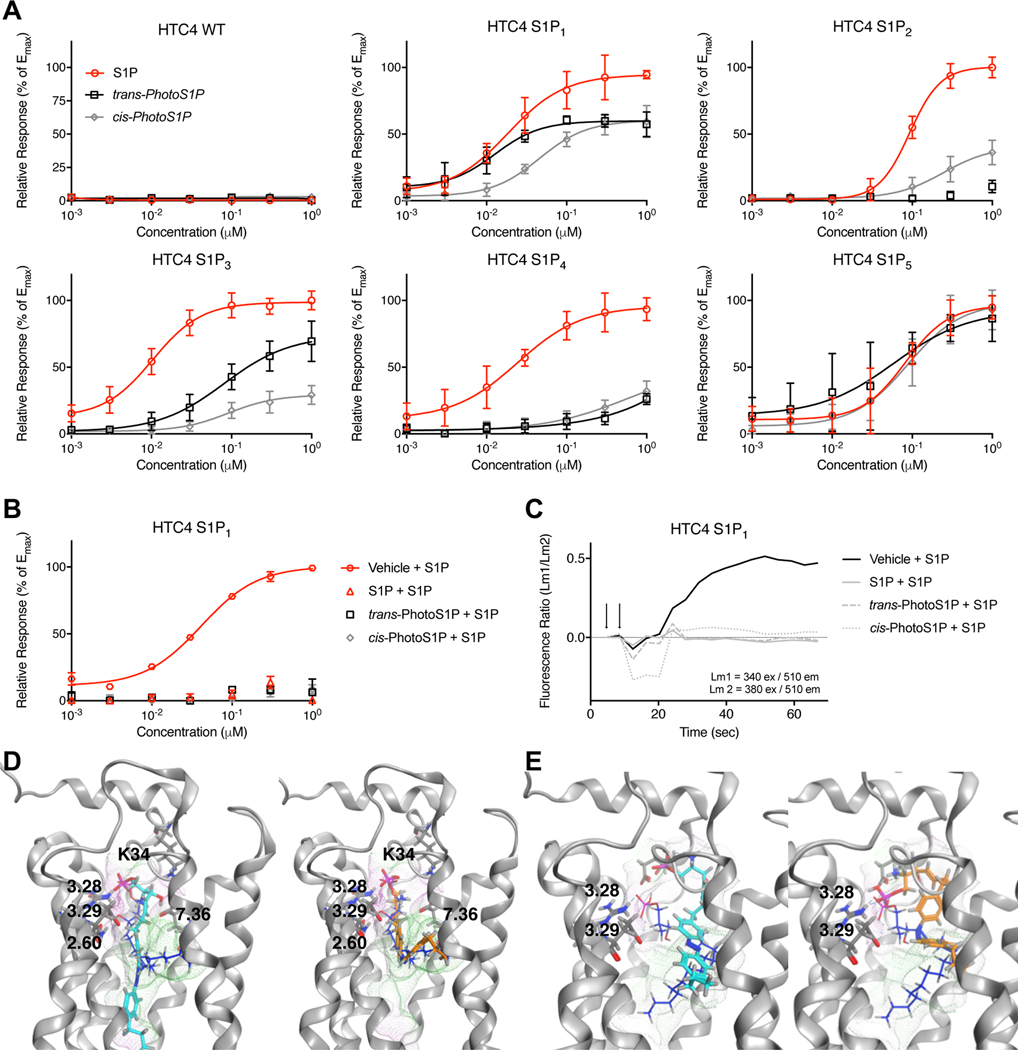
Figure 3 |. Optical control of S1P1–5 receptor-mediated calcium release and homology modelling of S1P1–2 receptors.
(A) Fura2-AM calcium imaging in HTC4 cells stably transfected with S1P1–5 receptors. Dose response of S1P, trans-PhotoS1P and cis-PhotoS1P in HTC4, HTC4 S1P1, HTC4 S1P2, HTC4 S1P3, HTC4 S1P4, and HTC4 S1P5 cells. Samples (N = 8) were run in quadruplicates and at two independent experiments. Data points were normalized to maximal S1P response for each receptor. Error bars represent mean ± S.D. (B,C) Calcium mobilization in HTC4 cells stably transfected with S1P1 receptor after prior treatment with S1P (300 nM), cis-PhotoS1P (300 nM), trans-PhotoS1P (300 nM), or vehicle (CS-BSA, 300 nM). Data points were normalized to maximum S1P response. Error bars represent mean ± S.D. Representative traces after application of 300 nM S1P are shown in (C). Samples (N = 3) were run in triplicates. (D,E) Computationally-predicted binding poses for S1P (blue), trans-PhotoS1P (cyan) and PhotoS1P (orange) docked into S1P1 (D) and S1P2 (E). Receptor pocket surface is highlighted in green (hydrophobic)/ violet(hydrophilic).

