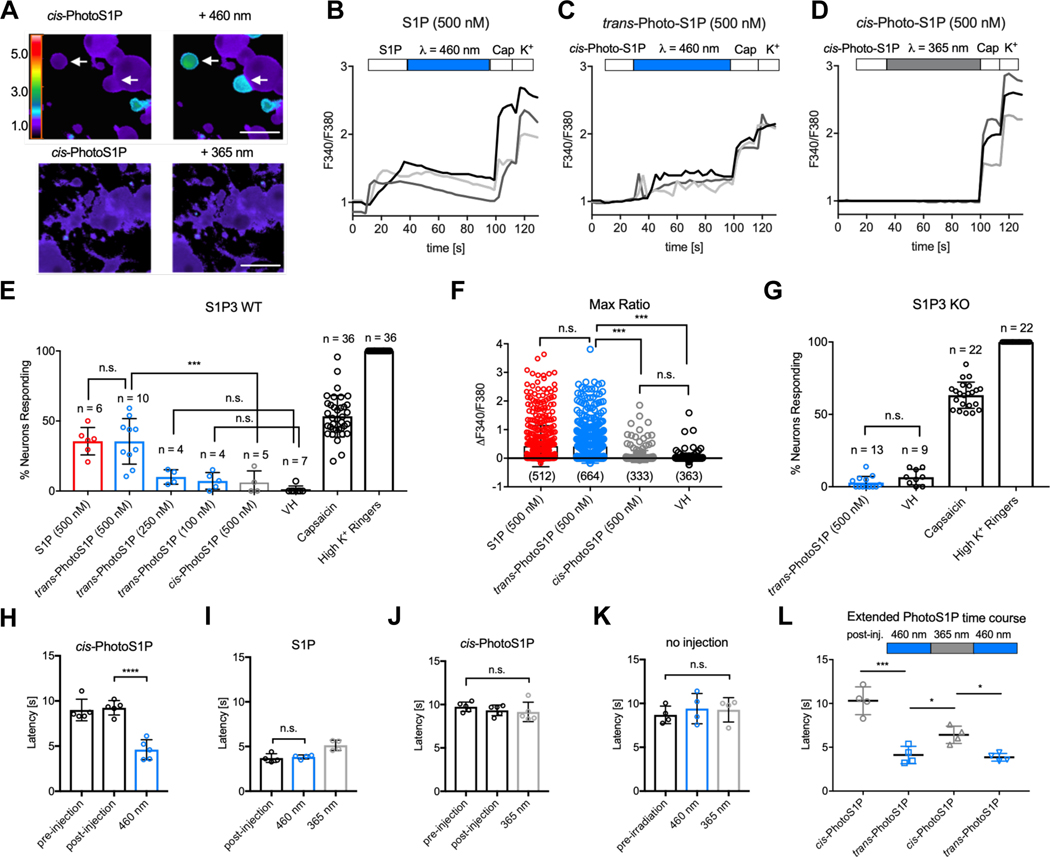
Figure 4 |. Optical control of nociception in DRG neurons and mice.
(A) Representative images depicting Fura2-AM Ca2+ imaging of WT DRG neurons after addition of cis-PhotoS1P (500 nM, upper and lower left) and after illumination with 460 nm light to trigger isomerization to trans-PhotoS1P (upper right) or illumination with 365 nm light (lower right). Rainbow scale indicates F340/F380 ratio; scale = 50 μm. (B,C,D) Representative traces (light grey, dark grey, back) of three DRG neurons each displaying the F340/F380 signal from Fura2-AM Ca2+ imaging with addition of S1P (500 nM; B) or cis-PhotoS1P (500 nM; C-D), with illumination at 460 nm to trigger isomerization to trans-PhotoS1P (C), or illumination at 365 nm (D). At the end of all experiments, capsaicin (1 μM) was added to trigger activation of TRPV1+ nociceptors and high K+ Ringer’s solution was added to activate excitable neurons. (E) Quantification of % of total wild-type (WT) mouse DRG somatosensory neurons responding to S1P (500 nM), trans-PhotoS1P (500 nM), trans-PhotoS1P (250 nM), trans-PhotoS1P (100 nM), cis-PhotoS1P (500 nM), vehicle control (VH), capsaicin (1 μM) and high K+ Ringer’s solution (***p < 0.0001; F(7,100) = 165.5; one-way ANOVA). Tukey’s multiple comparisons p-values (left to right): n.s. > 0.999; *** = 0.0002; n.s. = 0.8659; n.s. = 0.9715. Experiments were performed on a total of 2,322 neurons from N = 3 animals, with n = number 50 of imaging experiments of 20–100 DRG neurons each. Experiment was repeated a total of three times (once per animal used), yielding similar results. (F) Max change in F340/F380 ratio after addition of S1P (500 nM), trans-PhotoS1P (500 nM), cis-PhotoS1P (500 nM), or vehicle control (VH) (***p < 0.0001; F(3,1848) = 4.41; one-way ANOVA). Tukey’s multiple comparisons p-values (left to right): n.s. = 0.9841; *** < 0.0001; *** < 0.0001; n.s. = 0.8213. n = number of DRG cells from N = 3 animals. (G) Quantification of total S1P3 receptor KO DRG neurons responding to trans-PhotoS1P (500 nM), vehicle control (VH), capsaicin (1 μM), and high K+ Ringer’s solution (p = 0.081; t = 1.84; d.f. = 20; two-tailed unpaired t-test). Experiments were performed on a total of 1,114 neurons from N = 3 animals, with n = number of imaging experiments of 20–100 DRG neurons each. Experiment was repeated a total of three times (once per animal used), yielding similar results. (H) 5 mM cis-PhotoS1P was injected into one hind paw of WT mice. Paw withdrawal latency was recorded 20 min before and 10 min after injection. The paw was irradiated at 460 nm (***p < 0.0001; F (2, 12) = 31.16; one-way ANOVA, N = 5 mice); ***p < 0.0001 (Tukey’s multiple comparisons). (I) Paw withdrawal latency was recorded 10 min after injection of S1P (10 mM), after irradiation at 460 nm for 3 min, and after irradiation at 365 nm for 3 min (**p = 0.0028; F (2, 9) = 12.09; one-way ANOVA, N = 4 mice); n.s. = 0.92 (Tukey’s multiple comparisons). (J) The contralateral paws of mice in (H) were injected with cis-PhotoS1P as before, and irradiated at 365 nm for 3 min each (p = 0.5108; F(2,12) = 0.7107; one-way ANOVA, N = 5 mice). Paw withdrawal latency was recorded directly after irradiation. (K) Paw withdrawal latency was recorded in a non-injected control group before irradiation, after irradiation at 460 nm for 3 min, and after irradiation at 365 nm for 3 min (p = 0.7553; F (2, 9) = 0.2896; one-way ANOVA, N = 4 mice). (L) Experiment was conducted as in (H, J), but withdrawal latency was recorded after a subsequent cycle of irradiation at 365 nm for 3 min, and after a cycle of irradiation at 460 nm for 3 min (**p = 0.0013; F (1.478, 4.435) = 45.21; one-way ANOVA, N = 4 mice). Tukey’s multiple comparisons p-values (left to right): ** = 0.0047; * = 0.0208; * = 0.0220. Unless otherwise indicated, error bars represent mean ± S.D. and statistics were performed using one-way ANOVA followed by Tukey-Kramer post hoc test or two-tailed t-test, where appropriate.

