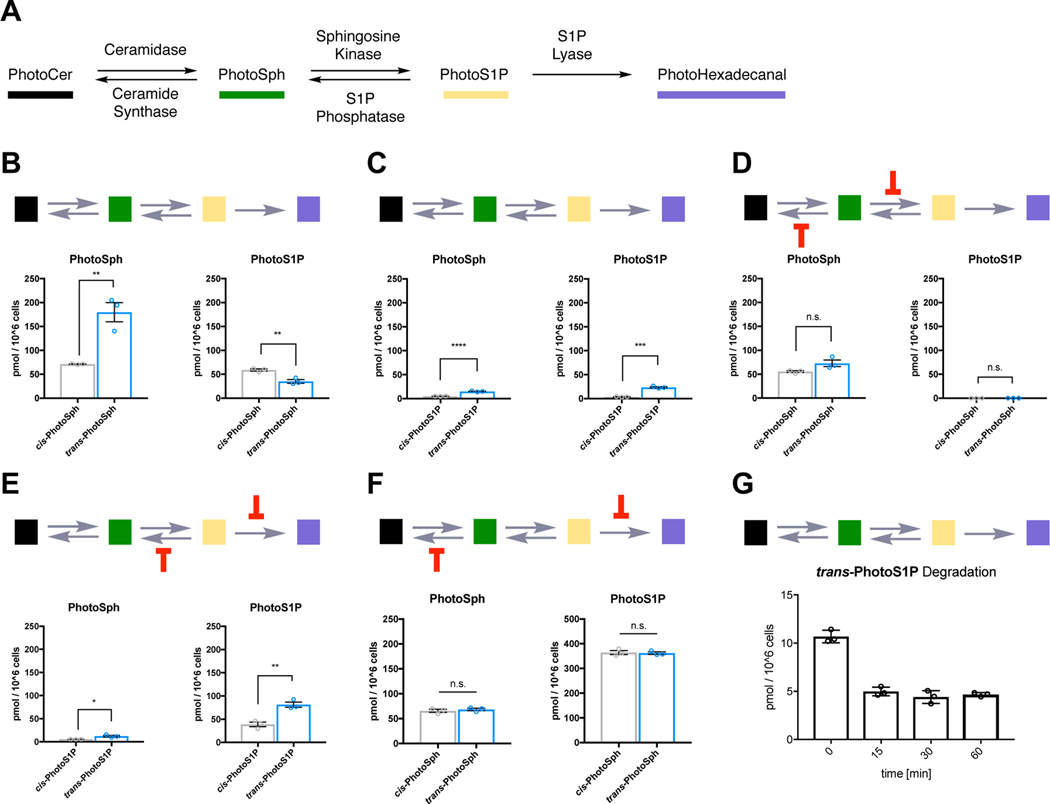
Figure 6 |. Lipid mass spectrometry analysis of PhotoSph/PhotoS1P metabolism.
(A) Metabolic network of photoswitchable sphingolipids. (B) WT HeLa MZ cells were treated with photoisomers of PhotoSph for 15 min. PhotoSph (left) and PhotoS1P (right) were extracted and quantified (**p < 0.0055 and **p = 0.0050 (left to right); two-tailed student’s t-test, N = 3 biologically independent experiments). (C) WT HeLa MZ cells were treated with photoisomers of PhotoS1P for 15 min. PhotoSph (left) and PhotoS1P (right) were extracted and quantified (****p < 0.0001; ***p = 0.0002; two-tailed student’s t-test, N = 3 biologically independent experiments). (D) HeLa MZ SPHK1/2 dKO cells were treated with photoisomers of PhotoSph for 15 min in the presence of fumonisin B1 (10 μM) to block ceramide synthases. PhotoSph (left) and PhotoS1P (right) were extracted and quantified (n.s. = 0.0716 and n.s. = 0.1752 (left to right); two-tailed student’s t-test, N = 3 biologically independent experiments). (E) McA-RH7777 Sgpl1/Sgpp1/Sgpp2 triple KO cells were treated with photoisomers of PhotoS1P for 15 min. PhotoSph (left) and PhotoS1P (right) were extracted and quantified (**p = 0.0048; *p = 0.0211; two-tailed student’s t-test, N = 3 biologically independent experiments). (F) McA-RH7777 Sgpl1 KO cells were treated with photoisomers of PhotoSph for 15 min in the presence of fumonisin B1 (10 μM) to block ceramide synthases. PhotoSph (left) and PhotoS1P (right) were extracted and quantified (n.s. = 0.4989 and n.s. = 0.7910 (left to right); two-tailed student’s t-test, N = 3 biologically independent experiments). (G) Metabolic stability of trans-PhotoS1P. WT HeLa cells were treated with trans-PhotoS1P and PhotoS1P was extracted and quantified after 0, 15, 30, and 60 min, respectively. Error bars represent SEM.

