
Fig. 2.
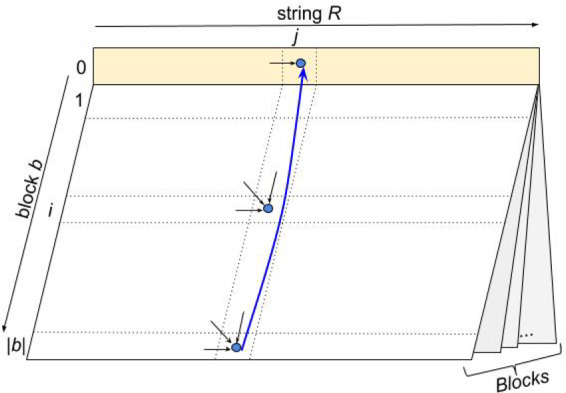
The SD graph represented as a ‘book’ where each page corresponds to an alignment matrix for a single block, and pages are ‘glued’ together by their 0-th row. Arrows represent edges of the String Decomposition Graph. Block-switching edge is colored in blue