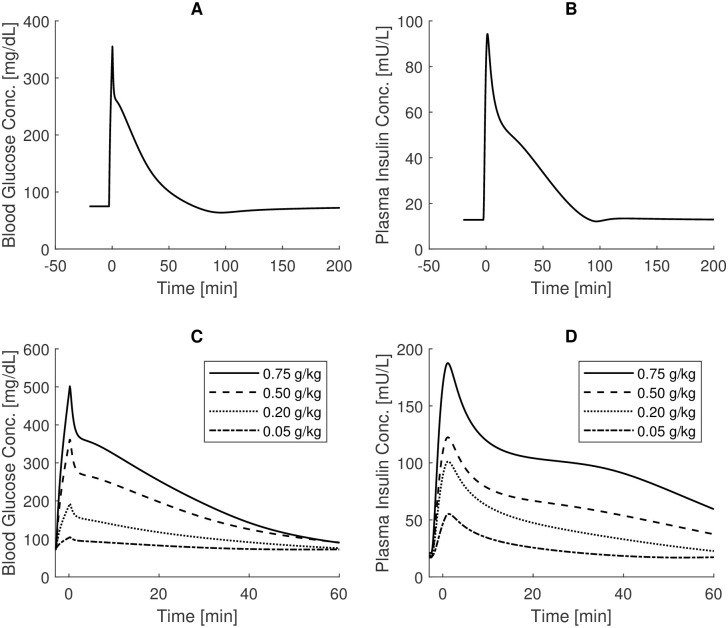
Fig 2. IVGTT Sorensen simulations.
Top panels: blood glucose and plasma insulin concentrations over time as derived from the CNR-IASI BiomatLab Sorensen model implementation following a standard 0.5g/kg IVGTT experiment (comparison with Fig 71, page 270 of the original work [23]); bottom panels: blood glucose and plasma insulin concentrations over time obtained in correspondence of variable IVGTT doses (comparison with Fig 73, page 273).

