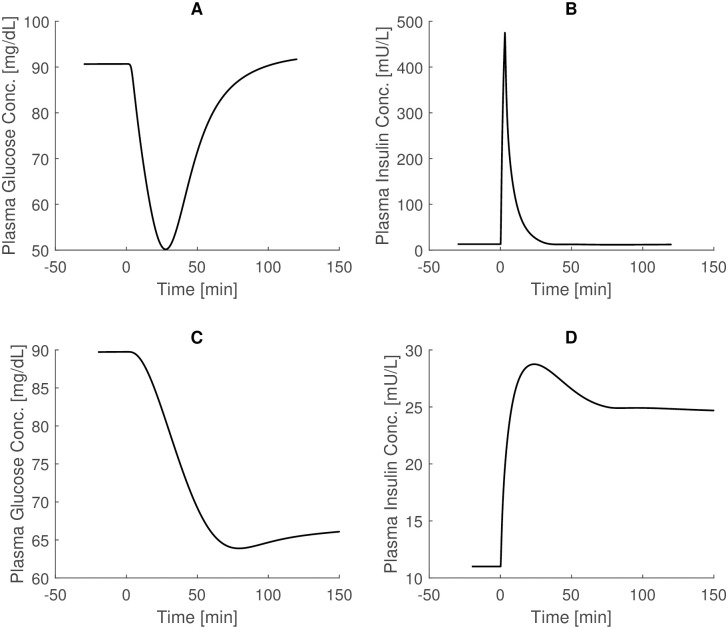
Fig 3. IVITT Sorensen simulations.
Top panels: glucose and insulin trends following a 0.04 U/Kg Intravenous Insulin Tolerance Test (IVITT) experiment, with insulin administration in 3 minute (comparison with Fig 74, page 277 of [23]). Bottom panels: glucose and insulin trends following the 150 minutes of 0.25 mU/kg Continuous Intravenous Insulin Infusion experiment (comparison with Fig 75, page 279 of [23]). The glucose state variable is multiplied by 0.925 to obtain the venous plasma glucose concentration.

