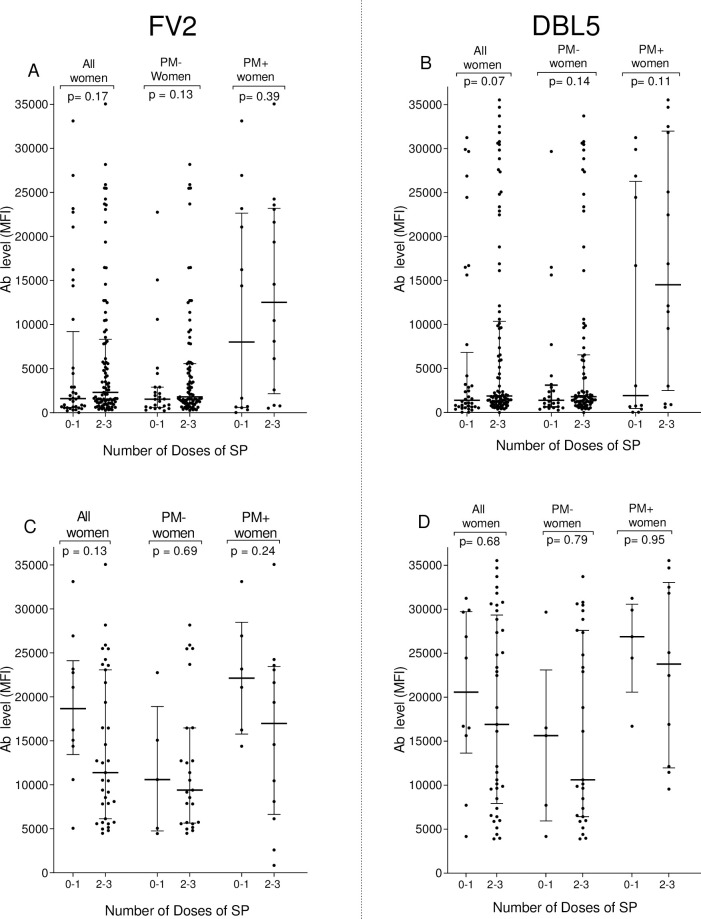
Fig 3. Influence of number of doses of SP on Ab levels to VAR2CSA (FV2 and DBL5) at delivery.
Mann-Whitney Rank Sum test was used to compare median plasma Ab levels to VAR2CSA between groups. A and B: IgG levels for all women (n = 130). C and D: IgG levels for Ab-positive women (n = 45 women for FV2, n = 47 women for DBL5). MFI: median fluorescence intensity; IQR: interquartile range; Ab: antibody; The cut-off for Ab-positivity was 4,483 MFI for FV2 and 3,232 MFI for DBL5. Horizontal bars represent the group median +/- 25% IQR.

