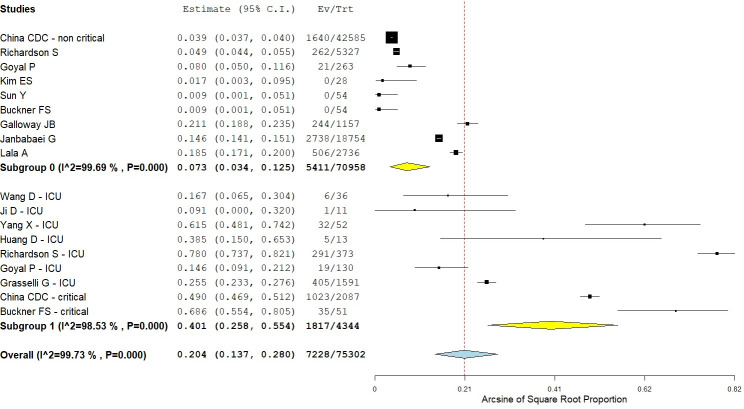
Fig 4. Subgroup analysis of case fatality rate.
Black squares indicate the mean effect size and horizontal lines represent the 95% CI of the effect size in single studies. Diamond shapes indicate the summary effect size and the relative 95% CI for each subgroup (yellow diamonds) and the overall summary effect (light blue diamond). The red dotted vertical line indicates the overall summary effect.

