Figure 9.

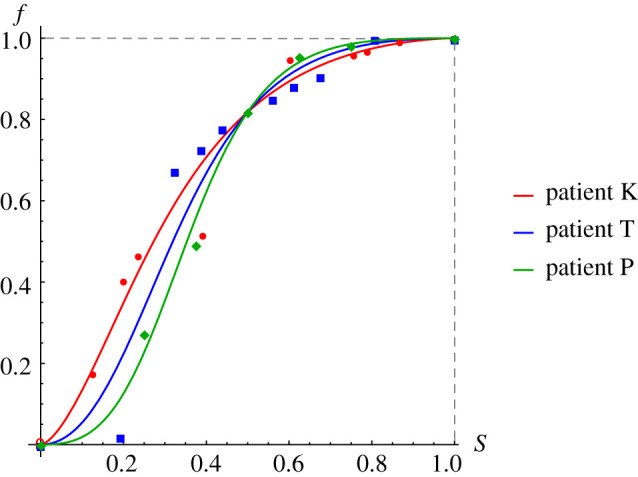
Buckley–Leverett functions constructed using clinical data: circles for patient K, squares for patient T, diamonds for patient P. Lines present Corey model approximations.

Buckley–Leverett functions constructed using clinical data: circles for patient K, squares for patient T, diamonds for patient P. Lines present Corey model approximations.