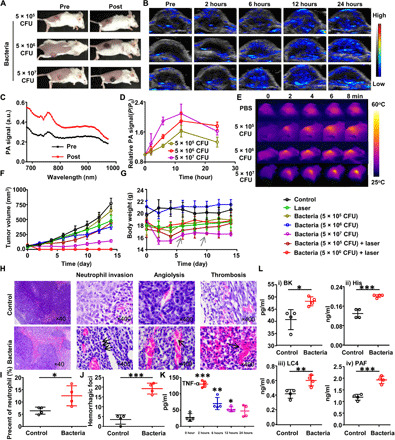
Fig. 2. Bacteria-triggered photothermal ablation of CT26 tumors.

(A) Photographs of BALB/c mice before or after injection of bacteria at the doses of 5 × 10⁵ colony-forming units (CFU), 5 × 10⁶ CFU, and 5 × 10⁷ CFU. (B) Representative PA images tumors on mice intravenously injected with different doses of bacteria. (C) PA spectra from 680 to 980 nm for CT26 tumors on mice before or after injection of bacteria. (D) Quantification of relative PA signals of CT26 tumors on mice injected with bacteria at the doses of 5 × 10⁵ CFU, 5 × 10⁶ CFU, and 5 × 10⁷ CFU. Data are presented as the mean ± SD. (E) Representative IR thermal images of the mice injected with bacteria at the doses of 5 × 10⁵ CFU, 5 × 10⁶ CFU, and 5 × 10⁷ CFU under 808-nm laser irradiation. (F) Tumor growth curves of mice with different treatments indicated (n = 5 per group). Data are presented as the mean ± SEM. (G) Average body weights of mice after various treatments indicated. The gray arrow represents the death of mouse. Data are presented as the mean ± SEM. (H) Representative images of hematoxylin and eosin (H&E)–stained tumor slices collected from mice injected with phosphate-buffered saline (PBS) or bacteria. (I and J) Quantification to show percentages of neutrophils (I) and hemorrhagic foci (J) based on H&E-stained images. (K) The tumor necrosis factor–α (TNF-α) levels in sera from mice isolated at 0, 2, 6, 12, and 24 hours after bacteria injection. P values were determined between TNF-α level at 0 hour and that at other time points. (L) The inflammatory factors including bradykinin (BK), histamine (His), leukotriene C4 (LC4), and platelet-activating factor (PAF) levels in sera from mice isolated before or 12 hours after bacteria injection. Data are presented as the mean ± SD. Statistical analysis was performed using the Student’s two-tailed t test (***P < 0.001, **P < 0.01, and *P < 0.05). a.u., arbitrary unit. Photo credit for (A): Xuan Yi, Soochow University.
