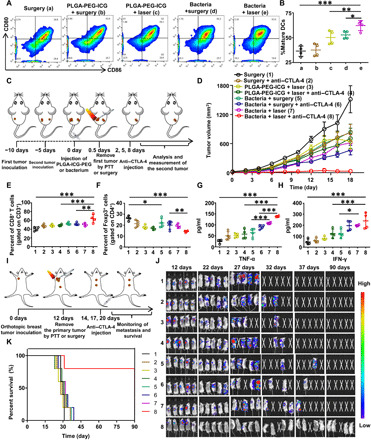
Fig. 4. Bacteria-induced photothermal immunotherapy.

(A and B) Representative flow cytometry plots (A) and quantification (B) of DC maturation induced by bacteria-based PTT on mice bearing CT26 tumors (gated on CD11c+DC cells). Cells in the tumor-draining lymph nodes were collected 72 hours after various treatments for flow cytometry assessment after staining of CD11c, CD80, and CD86. Data are presented as the mean ± SD. (C) Schematic illustration of bacteria-based photothermal immunotherapy to inhibit tumor growth at distant sites. (D) The growth curves of secondary abscopal tumors for different groups of mice (five mice per group) with after various treatments to eliminate their primary tumors. Data are presented as the mean ± SEM. (E and F) Proportions of tumor-infiltrating CD8+ killer T cells among CD3+ cells (E) and proportions of CD4+FoxP3+ regulatory T cells among CD4+ cells (F) in the abscopal CT26 tumors at day 10. (G and H) The TNF-α level (G) and interferon-γ (IFN-γ) level (H) in sera from mice isolated at day 10. (I) Schematic illustration of bacteria-based photothermal immunotherapy to inhibit spontaneous metastases. (J) In vivo bioluminescence images to track the spreading of fLuc-4T1 cancer cells in different groups of mice after various treatments to eliminate their primary breast tumors. (K) Morbidity-free survival of different groups of mice-bearing orthotopic 4T1 tumors with spontaneous metastases after various treatments indicated to eliminate their primary breast tumors (10 mice per group). Data are presented as the mean ± SD. Statistical analysis was performed using one-way analysis of variance (ANOVA) with the least significant difference post hoc test (***P < 0.001, **P < 0.01, and *P < 0.05).
