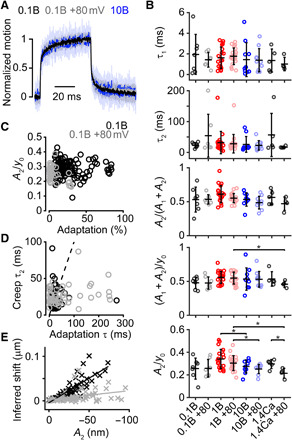
Fig. 2. Hair-bundle creep does not correlate with adaptation magnitude for different intracellular Ca2+ buffering and holding potentials.

(A) Mean (solid) ± SD (shaded) of the normalized displacements eliciting a current with an amplitude of ~50% Imax from 0.1 mM BAPTA recorded at −80 mV and +80 mV and 10 mM BAPTA at −80 mV. (B) Summary plots of the bundle creep properties for all conditions in Fig. 1. From the top, the plots show the fast (τ1) and slow (τ2) time constants of the creep, the relative magnitude of the slow component of the creep [A2/(A1 + A2)], the magnitude of creep normalized to the total displacement [(A1 + A2)/y0], and the magnitude of the slow creep component normalized to the total displacement (A2/y0) for a given step. (C) No correlation (Pearson’s r = 9.2 × 10⁻⁴, P = 0.99) was found between A2/y0 and the adaptation magnitude for cells recorded with an intracellular concentration of 0.1 mM BAPTA at negative (black) and positive (gray) potentials. (D) A slight correlation (Pearson’s r = 0.24, P = 8.7 × 10⁻⁴) was found between τ2 and the slow adaptation τ in all cells recorded with an intracellular concentration of 0.1 mM BAPTA at negative (black) and positive (gray) potentials. Dashed line represents the trend for an ideal linear correlation. Correlation analysis includes all positive deflections in all cells except for the smallest deflection, where the signal-to-noise ratio was low. (E) Correlation between the inferred shift and the slow component of the creep (A2) in all cells recorded with an intracellular concentration of 0.1 mM BAPTA at negative (black) and positive (gray) potentials. The cells held at positive potentials show a decreased slope in the inferred shift versus creep magnitude, indicating that these two variables are not causally related. Same statistical details and cell (animal) numbers are shown as in Fig. 1.
