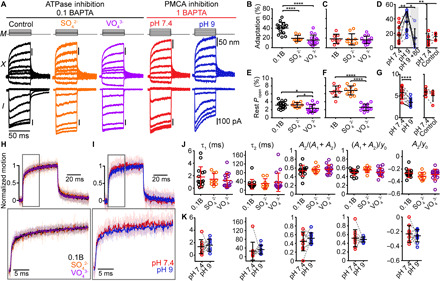
Fig. 3. Inhibition of myosin ATPase activity and PMCA pumps modulates slow adaptation, but not the hair-bundle creep.

(A) Hair-bundle displacements (X) and currents (I) recorded with stimulus waveform (M) using 0.1 mM BAPTA (control, black) with 60 mM cesium sulfate (Cs2SO4, orange) or 4 mM sodium orthovanadate (Na3VO4, purple) intracellularly. Using 1 mM BAPTA intracellularly, data were taken in normal extracellular solution (pH 7.4, red) and after 10-min PMCA inhibition with pH 9 (blue) in the same cell. Inhibition of ATPase activity and PMCA pumps has opposite effects on the adaptation magnitude. (B to D) Summary plots of adaptation magnitude and (E to G) resting open probability. (B and E) Using 0.1 mM BAPTA intracellular buffer with SO42− or VO43−. (C and F) Using 1 mM BAPTA intracellular buffer with SO42− or VO43−. (D and G) Before (pH 7.4) and after PMCA inhibition (pH 9). Gray shading indicates data at +80 mV. Additional control data plots show the adaptation magnitude and resting open probability at 5 min (pH 7.4) and 20 to 25 min in the normal pH 7.4 extracellular solution (Control). The cells shown in (A) are shaded. (H and I) Mean (solid) ± SD (shaded) of normalized displacements eliciting ~50% Imax with a color legend and an onset motion expansion (gray box). Summary plots of the bundle creep properties recorded during (J) ATPase inhibition or (K) PMCA inhibition. Dashed lines connect data points for a given cell. Mean ± SD shown. *P ≤ 0.05, **P ≤ 0.01, ****P ≤ 0.0001. Number of cells (animals): 0.1 mM BAPTA, 15 (13); 0.1 mM BAPTA-Cs2SO4, 8 (7); 0.1 mM BAPTA-Na3VO4, 16 (15); 1 mM BAPTA, 8 (8); 1 mM BAPTA-Cs2SO4, 10 (10); 1 mM BAPTA-Na3VO4, 14 (13); pH 9 to 10 (10); Control, 5 (5).
