
Fig. 4. The hair-bundle creep is uncorrelated with slow adaptation in vestibular hair cells when stimulated with flexible glass fibers.
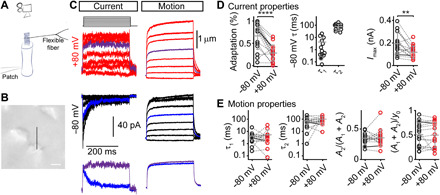
(A) Schematic representation of the experimental setup during the recording of MET currents in vestibular hair cells when stimulated with a flexible fiber. (B) Image of the vestibular hair bundle used for the recording in (C) with a black line to show where the bundle displacement was analyzed. Scale bar, 2 μm. (C) Currents and bundle displacements from the same cell in a P21 gerbil utricle when stimulated with a flexible glass fiber (0.139 mN/m stiffness) at +80 mV (red) and −80 mV (black). Marked traces (violet and blue) highlight a similar step size and are directly compared below. (D) Summary plots of the current properties for the stimulation eliciting ~50% Imax fit with a double exponential decay equation. The left plot summarizes the percentage of adaptation at −80 mV and +80 mV. Fast (τ1) and slow (τ2) adaptation time constants at −80 mV, as well as the Imax at −80 mV and +80 mV, are shown. (E) Summary plots of the bundle motion properties. Gray lines connect data points for a given cell, with cells shown in (A) marked. Bars represent mean ± SD. **P ≤ 0.01, ****P ≤ 0.0001. Number of cells (animals): 13 (13).