
Fig. 1. Chromatin accessibility and transcription on WT and IGCR1-mutated IgH alleles.
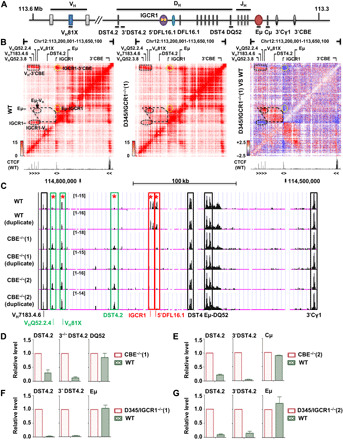
(A) Schematic map of IgH locus. Regulatory sequences are shown as colored ovals. Gene segments are indicated as colored boxes. Black lines under schematic refer to amplicons used in (D) to (G). (B) Capture Hi-C of WT (left) and IGCR1-deleted (middle) IgH alleles. Interacting regions are highlighted within dashed lines. Difference interaction map between WT and IGCR1-deleted IgH alleles is shown in the right. Decrease (blue) or increase (red) on IGCR1-deleted alleles is indicated. Position and orientation of CTCF-bound sites are indicated below heatmap (47). See also fig. S1A. (C) ATAC-seq assays of WT and IGCR1-mutated IgH alleles are shown (chr12: 114,554,576 to 114,839,712, mm9). Colored rectangles mark ATAC peaks that are (i) reduced by IGCR1 mutation (red), (ii) increased by IGCR1 mutation (green), or (iii) unaffected by IGCR1 mutation (black). Differential chromatin accessibility was quantified on the basis of moderated t tests using R package limma [*adjusted P value (false discovery rate) < 0.01]. Genomic localization and statistics of peaks are provided in fig. S1C. (D to G) RNA analyses of WT and IGCR1-mutated IgH alleles. Data are shown as means ± SEM of two (D, F, and G) or three (E) independent experiments.