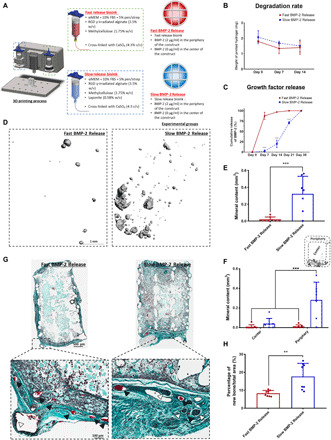
Fig. 2. Localized-temporal delivery of BMP-2 led to controlled bone formation.

(A) Schematic of the experimental groups. Construct design (4 mm in diameter, 5 mm in height). αMEM, alpha minimum essential medium. (B) Degradation of the two bioinks. (C) Cumulative release of BMP-2 of the fast release bioink versus the slow release bioink. (D) 3D reconstructions of the μCT data for each group at 8 weeks. (E) μCT analysis on total mineral deposition of each of the groups after 8 weeks in vivo. (F) μCT analysis on the location of mineral deposition of each of the groups after 8 weeks in vivo. ***P < 0.001; error bars denote SDs (n = 8 animals). (G) Goldner’s trichrome–stained sections of both groups after 8 weeks in vivo. Images were taken at 20×. White arrows denote developing bone tissue, and black arrows denote blood vessels. (H) Quantification of the amount of new bone formation per total area. Error bars denote SDs; **P < 0.01 (n = 8 animals, n = 6 slices per animal).
