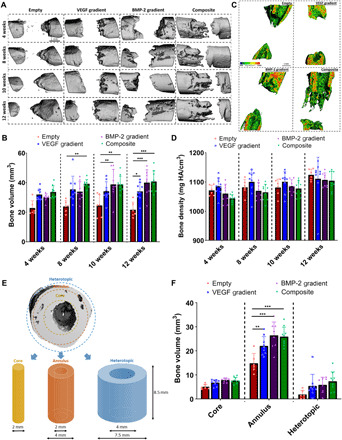
Fig. 5. Spatiotemporal delivery of both VEGF and BMP-2 led to enhanced bone tissue distribution 12 weeks after scaffold implantation.

(A) Reconstructed in vivo μCT analysis of bone formation in the defects. (B) Quantification of total bone volume (mm3) in the defects at each time point. (C) Representative images of μCT bone densities in the defects at 12 weeks halfway through the defect (scale bar, 1 mm throughout). (D) Average bone density (mg HA/cm3) in the defects at each time point. (E) Outline of ROI bone volume analysis including definitions of core, annulus, and heterotopic regions. (F) Total bone volume (mm3) in each region at 12 weeks. **P < 0.01, ***P < 0.001, and ****P < 0.0001; error bars denote SDs (n = 9 animals).
