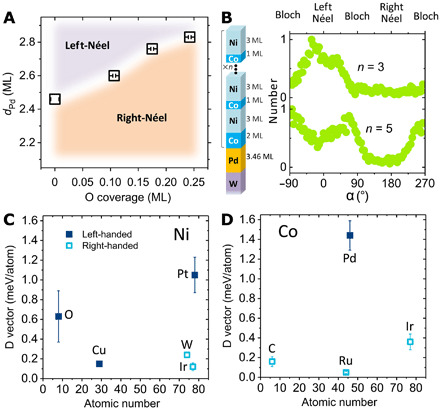
Fig. 3. Quantification of oxygen chemisorption–induced DMI.

(A) Phase diagram of chirality in dPd-dO space. The dependence of wall texture transition points permits the determination of the oxygen-induced DMI by comparing with Pd thickness–induced DMI variation. (B) Histogram of angle α in the [3Ni/1Co]2/3Ni/2Co/3.46Pd/W(110) multilayer (upper plot, total Ni/Co stack number n = 3) with a single peak near 0°, and histogram of angle α in the [3Ni/1Co]4/3Ni/2Co/3.46Pd/W(110) multilayer (lower plot, n = 5) with double peaks at ~−90° and ~+90°. Modeling the film thickness dependence of this chirality transition allows the determination of the DMI strength of the system. (C and D) Summarized magnitude of the DMI vector at the Ni/[nonmagnetic material] interfaces in (C) and Co/[nonmagnetic material] interfaces in (D), all extracted by the same approach used in this work.
