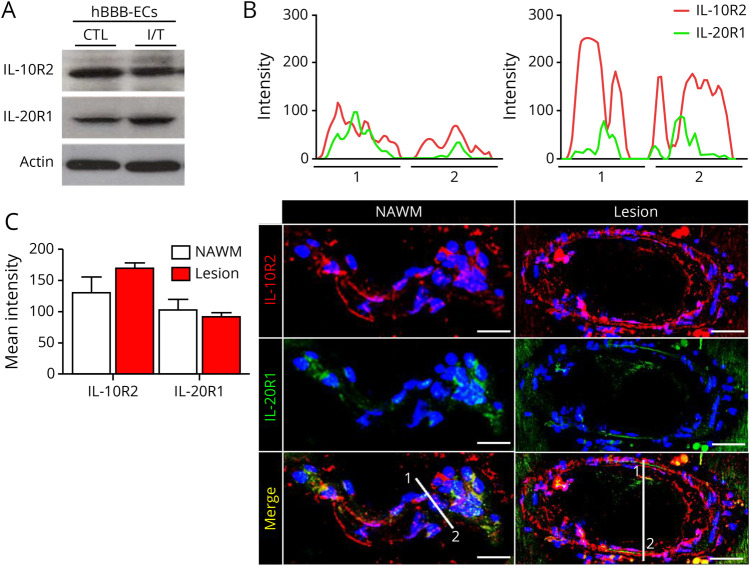
Figure 2. Presence of IL-10R2 and IL-20R1 on BBB ECs.
(A) IL-26 receptor expression on resting (CTL) and inflamed (IFNγ and TNFα, I/T) human BBB ECs by Western blot. Representative image of n = 4 experiments is shown. (B) Autopsy-derived MS CNS material stained for IL-10R1 (red) and IL-20R2 (green) and with TOPRO-3 (blue, nuclei). Representative plots of IL-20R1 and IL-10R2 signal intensity and colocalization of both receptor chain (upper graphs) in areas 1 and 2 are shown for NAWM (left) or MS lesions (right). (C) Semiquantitative analysis of the signal intensity from 10 µm z-stack reconstructions along the line markers in the images shown in (B), for IL-20R1 and IL-10R2, in NAWM and MS lesion. Mean fluorescence intensity was averaged from 3 distinct measurements on each vessel (n = 33 blood vessels). Images shown are representative of immunostainings on brain lesions of 6 patients with MS (1–2 tissue blocks per patient). Scale bars: 50 μm for lesion and 30 μm for NAWM. Data are represented as mean ± SEM (C). Statistical tests: Student 2-tailed t test (C). BBB ECs = blood-brain barrier endothelial cells; CTL = control; IL = interleukin; NAWM = normal-appearing white matter.

