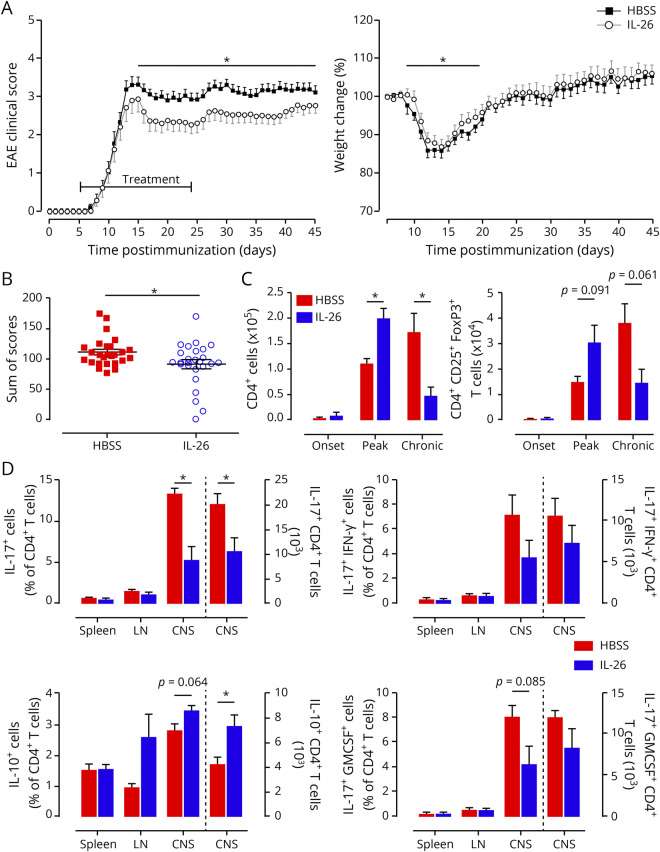
Figure 5. IL-26 treatment ameliorates clinical symptoms of EAE.
(A) MOG35–55 immunized C57BL/6 mice injected IP with either 200 μL HBSS (black squares) or 200 μL containing 200 ng recombinant human IL-26 in HBSS (gray open circles) were scored (left panel) and weighed (normalized to day 0; right panel) daily. IL-26 treatment was started at day 5 after disease induction and was given daily until day 24. (B) Distribution and sum of the clinical scores for the 2 different treatment groups. Each dot is 1 animal. (C) The CNS of perfused mice was collected, and infiltrating immune cells were isolated, counted, and analyzed by flow cytometry at onset (day 7), peak (day 15), and chronic (day 27) phases of disease. (D) The CNS, spleen, and LN of perfused mice were collected, and immune cells were isolated, counted, and analyzed by flow cytometry for intracellular cytokine staining at peak (day 15) of disease. Bars to the left of the dotted line represent cell percentages (left y-axis), and bars to the right of the dotted line represents total number of cells (right y-axis). Data are represented as mean ± SEM (A–D). *p < 0.05. Statistical analyses performed: Student 2-tailed t test of the area under the curve (A); Student 2-tailed t test (B–D). Data shown are representative of 6 independent EAE experiments with 9–30 animals per group (A and B). n = 3 animals per group (C and D). EAE = experimental autoimmune encephalomyelitis; GM-CSF = granulocyte macrophage colony-stimulating factor; HBSS = Hanks balanced salt solution; IL = interleukin; LN = lymph nodes; MOG = myelin oligodendrocyte glycoprotein; SEM = standard error of the mean.

