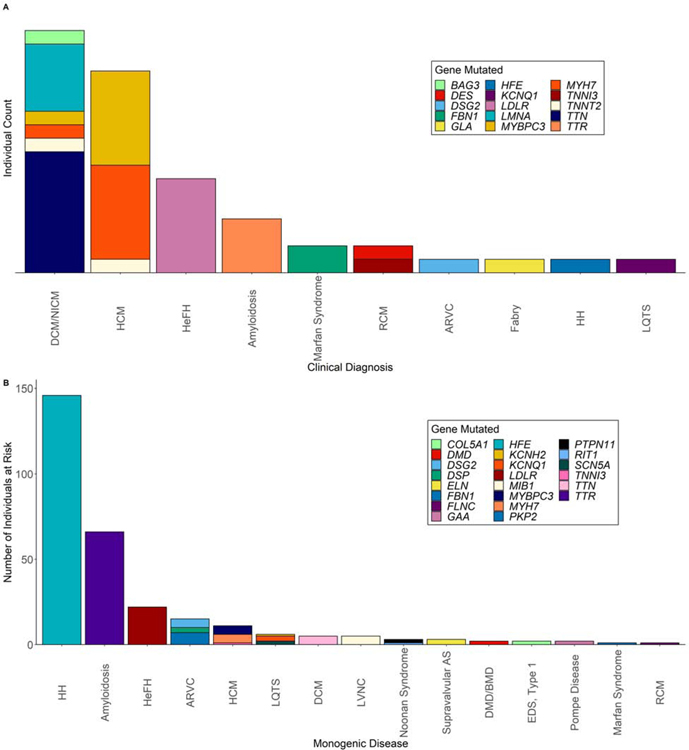
Figure 3. Genes mutated in individuals clinically diagnosed and individuals at risk of developing a monogenic disease but not diagnosed.
(A) Bar plot illustrating the 52 individuals who were given the relevant clinical diagnosis and the respective gene that was mutated. (B) Bar plot illustrating the 290 individuals at risk for developing a MCVD, and the respective gene that was mutated. Abbreviations as in Central Illustration.

