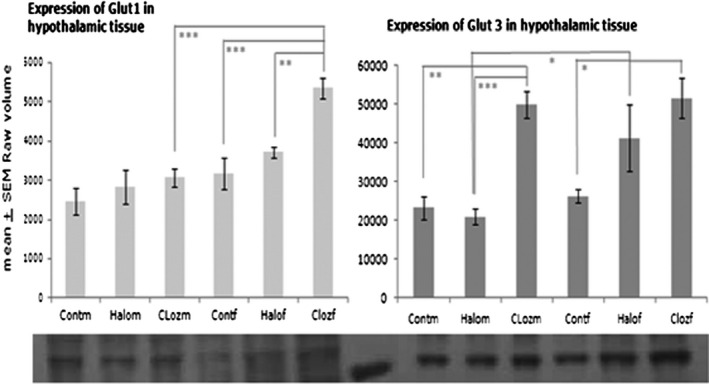
FIGURE 2.

Expression of the glucose transporters Glut1 and Glut3 in hypothalamic membrane fraction after 12‐week medication of clozapine or haloperidol in male and female Sprague Dawley rats (Cloz, clozapine medicated; Cont, control; f, female; Halo, haloperidol medicated; m, male), n group = 10 for Glut1 and n group = 5 for Glut3 with *p ≤ .05, **p < .001 and ***p < .0001. The autoradiographs show the glucose transporter expression of pooled probes of each treatment group
