
FIGURE 4.
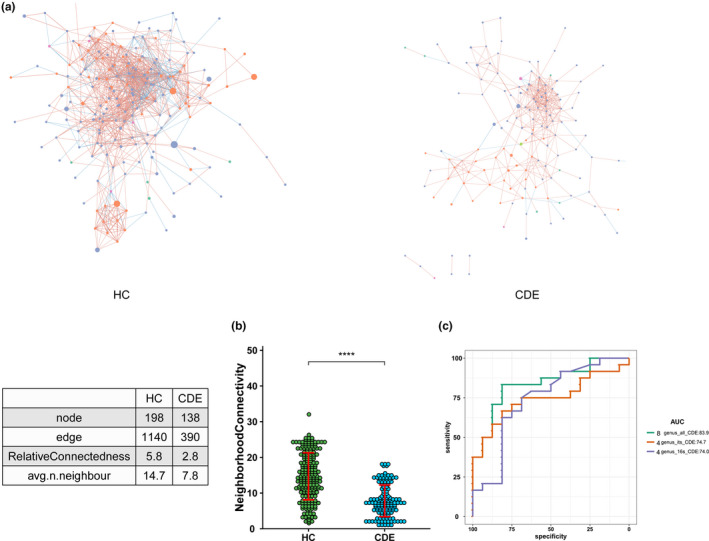
(a) Correlation networks at the family and genus levels were built in the two groups using distance correlation test. Abundance correlation networks are shown, in which each node represents a family or a genus, its shape, the kingdom (square, fungi; circle, bacteria), its color, and its size, the number of direct edges. Edges indicate the magnitude of distance correlation (positive in blue, negative in red). Only family and genus present in > 20% of the samples were taken into account, and only significant correlations (p < .05) are shown. The networks' parameters are presented in the table. The relative connectedness of the networks was calculated as the ratio between the number of significant interactions (edges) and the number of taxa (nodes) in the network. (b) Number of neighbors. Number of neighbors; means and SEM are indicated. **** indicates p < .0001. (c) Classification performance of multivariable logistic regression model using relative abundance of CDE‐associated genera was assessed by area under the receiving operational curve (ROC)