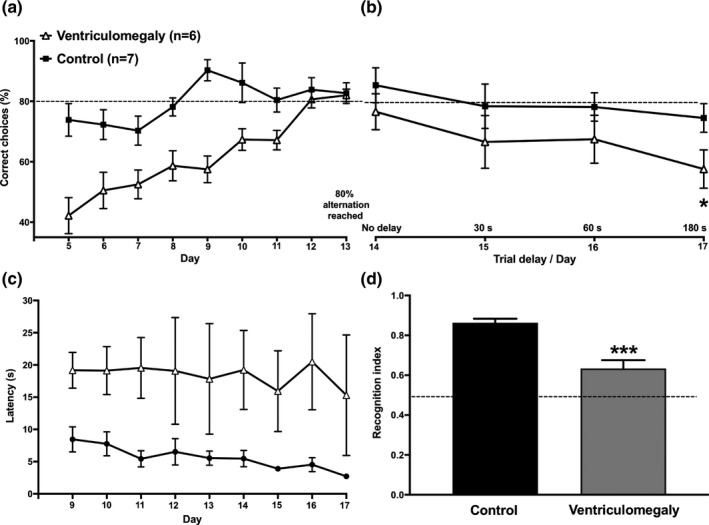
FIGURE 3.

Performance accuracy of the tasks. (a) The percentage of correct choices was calculated to evaluate the performance accuracy of the T‐maze task. A two‐way ANOVA revealed differences between groups while trying to achieve the 80% alternation criterion. (b) The percentage of correct choices presented in the task with a delay of 15 s was gradually lost in both groups when extending the delay interval to 30, 60, and 180 s. Tukey's multiple comparisons showed that the effect was more pronounced in the ventriculomegalic animals; reaching significance when exposed to the 180 s delay. (c) Shows the latency to enter the goal arm during the Information Run. Rats with ventriculomegaly had greater values when compared to the control group. (d) Shows the recognition indexes on object recognition memory test. A Wilcoxon test shows a significant difference between groups. All data are expressed as mean ± SEM. *p < .05; ***p < .001
